MISNISTRY OF EDUCATION AND TRAINING
CAN THO UNIVERSITY
NGUYEN QUOC NGHI
ENHANCED VALUE ADDED SOLUTIONS FOR
PINEAPPLE PRODUCT CONTRIBUTING TO
INCREASE INCOME FOR POOR HOUSEHOLDS
IN TIEN GIANG PROVINCE
ABSTRACT OF DISSERTATION
Specialization: Agricultural Economics
Code: 62 62 01 15
Can Tho, 11-2015
The research was completed at Can Tho University
Supervisors: Assoc. Prof. Mai Van Nam
Opponent 1: ..........................................................................................................
Opponent 2: ..........................................................................................................
The dissertation will be defended before the council of the school level at:
....... hour ........ date ......... month ........ year ..........
Learn about the dissertation in the library:
- Learning Resource Center – Can Tho University
- Vietnam National Library
CHAPTER 1. INTRODUCTION
1.1. RATIONALE
The study demonstrates the urgent and high practical significance based on the
following establishments: (i) Tien Giang has the largest raw materials of pineapples in
Viet Nam with over 15,000 ha (Tien Giang Statistical Office, 2014 ) and pineapples
are considered “Tree of poverty reduction” of Tien Giang province, (ii) the potential
market of pineapple industry is more growing, especially the US, EU, Japan, Korea (
FAO, 2013), (iii) The link among the actors in the pineapple product chain in Tien
Giang is still very “fuzzy”, (iv) there are many points “unanswered”, towards valueadded (VAT) of pineapple product which had not been studied and exploited properly,
(v) The received value of poor households who planting pineapple was inappropriate
to the investment and the their cultivating exist many risks, (vi) Value Chain is an
effective approach of managers, policy-makers aiming to improve the income of poor
households. Thus, the issue is given to tackle: (1) Improving the received benefits for
poor households who have been planting pineapple through improving the value-added
of pineapple products; (2) enhancing the VAT for the pineapple products through the
value chain upgrading. Therefore, the study of solutions to improve the value added
pineapple products contributed to improved income for poor households in Tien Giang
province. This should be considered as a subject with high imperatives.
1.2. RESEARCH OBJECTIVES
1.2.1. General objective
The dissertation aimed to analyze the activities of the stakeholders involved in
the pineapple value chain in Tien Giang province and analyze the VAT, VAT
distribution between the stakeholders who are in the pineapple value chain as well as
detect the bottlenecks that need to improve in order to enhance the economic value of
the chain, through which proposed a number of solutions to improve the income of
poor households who have been planting pineapples in Tien Giang province.
1.2.2. Specific objectives
The specific objectives of the dissertation need to be addressed as follows: (i)
analyze the production and consumption situations of pineapple products of the poor
households in Tien Giang province, (ii) analyze the activities of the stakeholders
involved in the pineapple value chain as well as the VAT and VAT distribution among
the stakeholders who are in the pineapple value chain, (ii) Compare the VAT between
groups of pineapple grower (the poor, the non-poor) and the impact of VAT distribution
to income towards group of pineapple producers in Tien Giang Hamlet, (iv) Propose
solutions to enhance the value added for the pineapple products contributing to improve
the income for poor households in Tien Giang province.
1.3. RESEARCH QUESTIONS
In this dissertation, the research question should focus on resolving the
following: (1) What is the situation of production and consumption of pinapple
products of the poor households in Tien Giang province like? (2) How much does
each stakeholder involved in the value chain created the value added for the
pineapple products like? (3) How is the distribution of VAT among the stakeholders
in the pineapple value chain? (4) What are measures and policies implemented to
enhance the VAT of pineapple products as well as improve the income for poor
hosueholds in Tien Giang Province?
1
1.4. RESEARCH OBJECTS AND RESEACH SPCOPE
Research objects: VAT generated in each stakeholder who participated in Tien
Giang pineapple value chain as well as the distribution of VAT and net VAT of
stakeholders in the value chain which are the research objects of the dissertation. In
particular, solutions aims to improve the income of the poor, through it, it focuses on
enhancing the VAT in the pineapple value chain.
Space scope: The Tan Phuoc pineapple materials (pineapple productivity
accounted for over 99% of Tien Giang province). Research space of the stakeholders in
the value chain was expanded by the method of linking the value chain of GTZ (2007).
Time Scope: Research time was determined just ended at the time of the study, it
means that the most recent harvest pineapples. The research period for each
stakeholder will be allocated by the method of linking the value chain.
Content scope: The VAT of pineapple products influenced by many random
factors and existed outside the control of the households (natural disasters, epidemics),
these elements are not mentioned in the dessertation. Due to limited resources, the
dissertation didnot analyze the pineapple export value chain in international consumer
markets. Besides, in the processing of the value chain, the content-related analysis of
the value of waste after processing (martial pineapple, crushed pineapple) is not
mentioned and analyzed in this dissertation.
CHAPTER 2: LITERATURE REVIEW
2.1. RESEARCH FOR THE VALUE CHAIN DUE TO THE POOR
Pro-poor growth is one of the goals outlined the most in promoting the
development of the value chain (ADB, 2007; FAO, 2004). Pro-poor growth
emphasized the importance of work to do for the poor to participate directly in
production, in economic growth and independence on social welfare (FAO, 2004).
Agricultural Policy Support Service Organization of FAO has developed the
guidance towards the value chain analysis for the rural development and the poor.
The methods begin with a comprehensive analysis of economic or agricultural areas
which are the most important. Based on the evaluation of the factors that make a
distinction between the poor and the rich in the value chain, the manufacturing subsectors are determined in accordance with the poor. Due to development purposes for
the poor, the Asian Development Bank studied to build of practice modular towards
the value chain analysis which titled “The making value chain more efficient for the
poor” or “ The marketing performance booster for the Poor” (ADB, 2007). This is a
very appropriate approach to the study of agricultural products, particularly products
related to the poor. According to ADB (2007), the starting point and the orientation
of value chain analysis of ADB is to improve market efficiency for the poor.
2.2. RESEARCH FOR THE PINEAPPLE VALUE CHAIN
Applying of the value chain theory GTZ (2007) and combining tools for the poor
DFID, Lirne (2009) conducted the study on the pineapple value chain in SriLanka. The
study showed that the growers cultivated pineapple with small scale and they did not
have any rights to negotiate the business. The study had proposed the establishment of
2
cooperatives to increase the ability to negotiate and support households minimize
transaction costs. The study of Preeyanat (2013), it studied on the balance between
supply and demand for the canned pineapple value chain in Thailand. Besides the
application of the value chain theory, Preeyanat (2013) also used the quantitative
models to identify factors that influence consumer decision-canned pineapple and
factors affecting output pineapple in production. Results showed that demanding for
canned pineapple was higher than fresh pineapple; this was the premise of cannedpineapple technological processing development in Thailand. Applying the value chain
theory of Gereffi (1994), Linda (2011) studied the efficiency of in Ghana through a
value chain analysis. Research results indicated that the bio-pineapple production cost
was not large, households produced with small scale which was not undermined by
production costs and gained high profits. Moreover, households who have been
growing bio-pineapple product could sign contracts with pineapple exporters in Ghana.
In addition, the study confirmed that the pineapple production followed safety standards
and brought many profitable and better selling prices than normal production.
2.3. RESEARCH FOR ADVANCING THE VALUE ADDED OF AGRICULTURAL
PRODUCTS
David et al (2000) found out 2 approaches for researching the VAT of agricultural
products. The first is innovation; this approach focused on improving the existing
processes, procedures, products and services. Gjerding et al (1997) suggested that
awareness of innovation was limited by its usefulness in economics and management.
Overall, the value added innovative activity development on the farms or agriculture
laboratory was the national source of growth through changed in the type of product
or production technology (Kraybill and Johnson, 1997). In addition, technological
innovation method was a specific type of innovation. The second was the
coordination; this approach focused on the arrangement between the producers and
agricultural markets. Horizontal coordination related to the synthesis, integration of
individuals of the same level of the value chain. Longitudinal coordination included
in contracting, strategic alliances, licensing agreements and sole ownership of the
market in many different stages of the value chain (Peterson and Wysocki, 1997).
Stern et al (1996) proved that the effective market included in many factors:
appropriate products related to consumer tastes, profit margin in the relationship
between marketing costs and profit, seasonal price and uniform price between
markets. Besides, the results of USAID (2008) also pointed out the factors of the
market efficiency including: price level and stability, net profit, profit and cost,
quantity and quality products. Lambert et al (1998) showed that there are two ways to
increase the VAT, the first way is to improve production efficiency, thereby
expanding the amplitude between the value of output and intermediate input costs,
and the second way is changing the form, function, quantity and characteristics of
product to increase the disparity between the value of output and input costs.
2.4. OVERVIEW OF LITERATURE REVIEW
Through overview domestic and foreign materials related to the agricultural
value chain, especially the study of pro-poor value chain, increasing value of
agricultural products. Table 2.1 indicates the source of document, content successor
to the dissertation and some broken slot found in the reference documents.
3
Table 2.1: Overview literature review
Sources
Viorel Leahu et al
(2011), Hualiang Lu
(2006), Tran Tien
Khai (2011), Nguyen
Phu Son (2012), Vo
Thi Thanh Loc
(2014)
Identifying broken slot
The study approached the theoretical value
chain of Kaplinsky & Morris (2001) and
“Linking value chain – ValueLinks” GTZ
(2007) succeeded in assessing the impact of
the economic value chain to local society,
Combining research
the value-added products for each market
based on two
channel, ability to participate in the value
perspectives both socio- chain of the household. However, these
economic and
studies have not demonstrated statistical
Fullbright
administration issues, significance in terms of the impact of the
Consultancy (2008),
upgrading the value
value chain or the value added of agricultural
Mahesh Ghimiray
chain
products to the household income, not clarify
(2007), Peniel Uliwa
differences, differences in VAT, VAT
(2010), Zuhui Huang
distribution of household groups in the value
Zhejiang (2009),
chain.
Anita msabeni (2010)
ADB (2007), Vo
Thi Thanh Loc et
al(2011), Cong
Thang et al (2004)
Lirne (2009),
Preeyanat
Eapsirimetee
(2013), Linda
Kleeman (2011)
Nguyen Van Hoa
(2011), Nguyen
Trinh Nhat Hang
(2013), Tran Thanh
Truc et al (2006)
Content successor
Most research focused on analyzing the
stakeholders involved in the value chain, the
value-added of products through stakeholders
in each major market channels, some research
divided according to domestic channels and
Research results are
export channels. Few research have focused
fundamental to propose
on the households, especially the poor, which
policy in order to
were learned about VAT, net VAT generated
promote the
from group of households in the value chain
participation in market
and factors affecting the VAT and net VAT
for the poor
of them. The impact of the use of resources to
the economic efficiency towards households
in the value chain as well as the content
“unanswered”of many researches on the
agricultural value chain.
Inapproach, detailed analysis of the
household resources, the ability to use inputs
Look at the
of households but just exploit the value chain
characteristics of
from households to consumers. This is the
stakeholders involved most important bottleneck of Vietnam’s
in the pineapple value agricultural sector, because farmers who
chain, analysis of major produce products that people are investing a
market channels
lot of efforts and enthusiasm but are
subjected to the most disadvantaged in the
value chain.
A strong understanding
of the technical
The research focused on technical aspects of
characteristics of
producing pineapples and solutions to
pineapples and propose enhance pineapple productivity, less
solutions to improve the attention to socio - economic efficiency.
technical efficiency
4
Increasing the VAT for
David Coltrain et al
agricultural products
(2000), Gjerding et al
through improving
(1997), Peterson và
production efficiency,
Wysocki (1997)
thereby expanding the
Quattri Maria
spread between the value
(2012), Lambert et
of the product and the
al (1998)
cost of inputs.
Not focused on exploiting efficiency of the
household market as well as identify causes
that made decrease in the value of
agricultural output markets. This is the key
point that need to exploit in agricultural
product market in Vietnam
Source: Synthesis of author
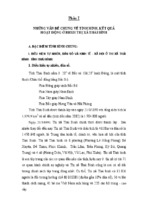
2.5. APPROACH METHODOLOGY AND RESEARCH FRAMEWORK
2.5.1. Approach methodology
The dissertation applied the approach “input” for the efficiency of agricultural
production of Farrell (1957) and “output” of the value chain of Kaplinsky & Morris
(2001), the method of linking the value chain of GTZ (2007) and enhance the market
for the poor (ADB, 2008).
Measuring the
effectiveness of
agricultural
production of
Farrell (1957)
The value-added and
income of the poor
who are pineapple
growers
The value chain of
Kaplinsky and Morris
(2000), method of
approach to the value
chain of GTZ (2007)
and tool of supporting
for the poor (M4P)
Source: Proposed by author
Figure 2.1: Way to research approach
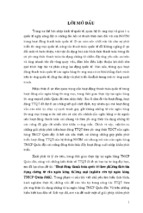
2.5.2. Research framework
Based on the approach the domestic and foreign findings through evaluating
literature review, to address the research objectives given, the research framework of
the dissertation was proposed as follows:
Source: Proposed by author
Figure 2.2: General research framwork
5
With the proposed research framework, the dissertation focused on detecting
bottlenecks towards efficiency of input resource utilization and bottlenecks of input
market efficiency. In particular, bottlenecks on the efficient use of inputs are detected
through the approach of production efficiency of Farrell (1957); Whereas the
bottlenecks of market efficiency is determined through the value chain approach of
Kaplinsky and Morris (2001), GTZ (2007) and ADB (2007). SWOT matrix analysis
(strengths, weaknesses, opportunities, threats) for the value chain is essential for
establishing the strategic upgrading of the pineapple value chain. Through it,
promoting the value added of pineapple products aiming to improve the household
income for the poor households who have been participating in the value chain.
CHAPTER 3: METHODOLOGY
3.1. DATA COLLECTION
3.1.1. Secondary data
The information about the area and pineapple productivity in Tien Giang province
was collected from Tien Giang Statistical Office (2014). The information on the
situation of production, area and productivity of Vietnam pineapple was collected from
the website of the Centre for Information and Statistics - Food Security Information
(http://fsiu.mard.gov.vn/) and information about the situation in the world pineapple
production obtained from the statistical website of the FAO organization
(http://faostat.fao.org/).
3.1.2. Primary data
Primary data was collected according to two methods which are quick interview
participatory (PRA twice at the study area) and direct interviews with each of the
stakeholders in the value chain of the pineapple in Tien Giang following the
appropriate sampling method (households were selected by the conditional quota
method and other stakeholders were selected by the method of liking the value chain
of GTZ (2007).
Table 3.1: The object survey of the dissertation
No
1
2
3
4
5
6
7
8
9
Stakeholders in the chain
Agricultural supplies dealers
Seed production facilities
The poor households growing pineapple
The no-poor households growing pineapple
Traders
Pineapple granary
Wholesalers
Processing businesses
Retailers
Chain supporters
Total
Source: Survey data, 2014
6
Number of
observation
5
7
98
128
20
15
12
3
37
10
335
3.2. DATA ANALYSIS
Data Envelopement Analysis (DEA) was used to analyze the pineapple
production efficiency of the poor, thereby identifying the bottlenecks in the use of
input resources of the poor. At the same time, the Linear Regression Analysis was used
to determine the elements of household resources that affect to the pineapple
production efficiency of the poor. Toolkit value chain analysis was used to illustrate
the diagram of the value chain, analyze the value added of the pineapple products and
the distribution of value-added between stakeholders in the value chain. Sensitivity
analysis method was used to evaluate the impact of VAT, the distribution of the VAT
to income of households growing pineapples. Methods of SWOT matrix analysis and
expert consultants were used to make the scientific basis for proposing solutions to
improve the value added of pineapple product contributed to improve the income for
the poor households in Tien Giang.
CHAPTER 4: FINDINGS AND DISCUSSIONS
4.1. SITUATIONS OF PINEAPPLE PRODUCTION AND CONSUMPTION
OF THE POOR HOUSEHOLD
4.1.1. Situation of pineapple production of the poor household
Pineapple seed: The poor households used the Queen Pineapple seed accounting
for 88.78%, others used Cayen, Spanish and some seeds are unknown origin. Origins
of pineapple varieties which was cultivated by poor households are diverse. There
was 24.49% of poor households use own pineapple varieties, 27.55% of poor
households buy seeds from traders but no clear information about the type of seed,
while about 23.47% of poor households had to buy or asked from neighbors.
Information about production techniques: The information of poor households
was accessible mainly from extension officers (accounting for 48.98%), followed by
the local acquaintances (occupying 37.76%), and the Farmer’s Association also was
quite important (accounting for 29.59%).
Capital investment in production: Poor households used capital of loans
accounted for 50%. For the loans of the poor, Bank for social policies was prioritized
loans (accounting for 52.27%), Bank for Agriculture and Rural Development was
42.05% of households. Some poor households accessed the capital from associations,
acquaintances and private loans.
Cultivation area: According to the survey results, the average area of cultivating
pineapples of the poor household was 9,083m2. In particular, the leased land
accounted for significant proportion. Most poor households have colonized the area
planted under 10,000 m2 (accounting for 61.23%).
4.1.2. Situation of pineapple consumption of the poor
Forms of communication with buyers: According to the survey, the poor
households were active to contact the buyers (representing 84.86%). However, the
buyer proactively contact to the poor accounts for 13.13%. Poor households have sold
pineapples through intermadiates which was very little (approximately 1.10%).
Output market of the poor: The majority of the poor households have sold
pineapples for long distance traders (accounting for 75.52%). Enterprises were also a
7
significant output stakeholder for poor households (accounting for 15.70%). Moreover,
poor households sold pineapples to wholesalers/ pineapple granary (accounting for
8.08%), retailers or local traders.
Forms of price decision: This represented the negotiating power of poor
households in the market. Poor households themselves decided price which was very
little (accounting for 3.06%), mostly pineapples were sold at market prices
(accounting for 68.37%) and the buyers decided (representing 28.57%).
4.1.3. Pineapple efficiency production of the poor
Based on estimated results of technical efficiency (TE), allocative efficiency
(AE) and cost efficiency (CE) of poor households produced pineapples (Table 4.1)
showed that poor households produced pineapple achieved technical efficiency which
was relatively high, while distribution efficiency of resources and cost efficiency
stayed at an average level
Table 4.1: The pineapple production efficiency of the poor
Value of efficiency
1.00
0.90 – 0.99
0.80 – 0.89
0.70 – 0.79
0.60 – 0.69
0.5 – 0.59
0.4 – 0.49
< 0.40
Average (optimum
efficiency)
Standard deviation
Technical
efficiency
19.39
7.14
14.29
22.45
20.41
13.27
3.06
0.00
Allocative
Efficiency
0.00
1.02
4.08
16.33
31.63
25.51
9.18
12.24
0.769 (19)
0.589 (0)
0.448 (0)
0.161
0.144
0.144
Cost efficiency
0.00
1.02
4.08
3.06
2.04
17.35
33.67
38.78
Source: DEA analysis redults from survey datat, 2014
Note: (optimum efficiency): A number of households reached at optimum efficiency;
According to the estimated results TE, AE and CE (Table 4.1) showed that poor
households produced pineapples achieved production efficiency at average level. The
average level of technical efficiency of poor households was 0.769 that was
correlative width (0.479 to 1.0). This result implied that the poor should have used
about 76.9% amount of the input to get productivity levels. In addition, the results
also suggested that households had TE less than 1 which should conducted to
minimize the inputs to practice saving and achieve technical efficiency. Allocative
efficiency of poor households growing pineapples reached at average level (AE =
0.589), in the range from 0.224 to 0.952. The results also showed that the cost
efficiency of the poor household was low and large degree of dispersion. There is no
household achieved the optimum cost efficiency (CE = 1). This result showed that the
total production cost of poor households should fall to 55.2% if they just reached
pineapple productivity at current.
With the current level of productivity, DEA analysis results (Table 4.2) showed
that the poor wasted a lot of inputs, especially waste of seeds, fertilizers and family
labor.
8
Table 4.2: The amount of input waste of the poor
Inputs
Seeds (tree 1000 m2)
Fertilizers (kg/1000 m2)
Pesticides (litre/1000 m2)
Stone gas (kg/1000 m2)
Fuel (litre/1000 m2)
Renting labor (day/1000 m2)
Family Labor (day/1000 m2)
Reality
2,847.56
87.80
78.43
0.57
2.65
2.00
12.32
Wastage
83.60
14.00
32.64
0.14
0.68
0.18
1.71
Source: DEA analysis results from the survey data, 2014
4.1.4. Influence of production resources to the technical efficiency and allocative
efficiency of resources of the poor planting pineapples
In agriculture, factors relating to production resources are quite diverse and they
can exist as physical forms as land, means of production, labor resources (Marsh,
2007). The rational use of productive resources would like to bring high efficiency in
agricultural production. In particular, human resources and labor resources are
considered important factors leading. Human resources are expressed not only in
quantity but also in quality of labor used in agriculture. There are many labor qualities
like elements of knowledge, skills and experience. Besides, education was considered a
key issue in the development. People who have high education can help households
enhance the ability to get information and easily apply the advanced science and
technology in production, efficiently use the inputs. This led to help households
cultivate more efficient (Huffma, 1977; Foster and Rosenzweig, 1996; Yang, 2004).
Also, in the field of farming, land was a prominant means of production and not
replaceable, more or less farming size also was a factor affecting the production
efficiency of the household (Nguyen The Nha, Vu Dinh Thang, 2004). Based on the
relevant information reviewed obove, whereby regression models assessed the impact
of production resources to the technical efficiency and allocative efficiency of
pineapple growers were set as follows:
TE = β0 + β1EXPERIENCE + β2EDUCATION + β3TECHNICAL APPROACH
+ β4OWN CAPITAL + β5AREA
AE = B0 + β1 EXPERIENCE + β2 EDUCATION + β3TECHNICAL APPROACH
+ β4OWN CAPITAL + β5AREA
In particular: β0 is the original coefficent (constant); βi is the impact coefficent of the
independent variables with the dependent variable. The dependent variable is measured by
the technical efficiency (TE) or allocative efficiency of resources (AE) of pineapple growers.
According to the analysis results (Table 4.3), the testing of models of
regression models were guaranteed: The model had statistical significance (= 0.000
Sig.F), variance inflation factor (VIF) of the variables in the model were less than 10.
This showed the variables were given into the model; there was no multicollinearity
phenomenon (Mai Van Nam, 2008). Also, the results of heteroskedasticity testing
(IM-test) proved phenomenon of error variance change in the model was negligible.
9
Table 4.3: Impact of production resources to the technical efficiency and allocative
efficiency of resources of poor households growing pineapples
Production sources
of poor households
Impact of production sources on
TE
Impact of production sources on
AE
Impact
Significance
VIF
Impact
Significance
VIF
coefficient
level
coefficient coefficient
level
coefficient
Experience
Education
Technical progress
approach
Proportion of own
capital
Farming area
Constant
Sig.F of model
Coefficient R2 (%)
IM-test
0.002
0.015
0.072
0.000
1,08
1,06
0,001
0,007
0,206
0,000
1,05
1,06
0.046
0.000
1,01
0,017
0,000
1,04
-0.020
0.183
1,03
0,058
0,000
1,09
0.000
0.733
0.659
0.000
1,12
0.000
22.00
0.35
-0,000
0,434
0,000
0,000
1,03
0.000
6.56
0.13
Source: Survey data, 2014
Based on the analysis results (Table 4.3) showed that education and technical
progress positively affected to TE and AE in pineapple cultivating of the poor. When
participating in technical training, poor households accessed to new farming methods,
knew how to produce following quality, increased productivity, economizely used of
inputs in order to match with available production resources. Analysis results
demonstrated that if the poor accessed more and more agricultural extension and
technical training programs, the TE and AE of poor households would be enhanced.
This showed the important role of accessing technical progress to improving TE, AE
in pineapple productivity of the poor. Besides, the results also confirmed the role of
education level which positively affected to TE, AE of pineapple growing
households. For poor households, if the level of education was more and more
increasing, TE and AE would increase. This result is consistent with research by
Yang (2004), Huffman (1977), Foster and Rosenzweig (1996). These are important
factors to keep in mind if you would like to build the advanced pineapple
manufacturing in development strategies which is specialized farming pineapple
areas of Tien Giang Province. Besides, self-production capital accumulation was
positive impact on poor households growing pineapples AE. This can be explained
that, if the poor autonomy of their investment as much (little use of loans), poor
households will be less pressure on the finance in production and get negotiating
position during the purchase of inputs. In fact, the survey showed that poor households
were restrictive financial conditions will be disadvantaged in buying the inputs. The
poor quality of fertilizers and pesticides in this case has significant impact on AE of
poor households. In addition, research results also showed that the production area
adversely affected towards AE of poor households. If farming levels unchanged, poor
households would be very difficult to "manage" well field when expanding production
scale, the distribution of the imported input factors would inevitably considerable
waste (fertilizers, pesticides, laubor).
10
4.2. THE VALUE CHAIN OF PINEAPPLE PRODUCTS IN TIEN GIANG
PROVICE
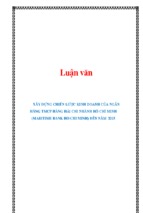
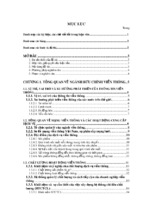
4.2.1. Describe the value chain of pineapple product in Tien Giang Province
The market channel of the pineapple value chain diagram in Tien Giang
province has been compiled from the value chain of each stakeholder of market
participants. Based on the pineapple distribution of each stakeholder to buyers, flow
rate of corresponding products would be shown on the diagram of the value chain in
order to ensure the ratio at the input actors of the chain (households) and the output
actors of the chain (consumers) were equal to 100% of the output of the whole chain.
Table 4.4: Distribution of pineapple productivity through stakeholders of the value chain
Output distribution
Stakeholders
(A)
Households
(100%)
Local traders
Pineapple
granary
Long-distance
traders
Wholesalers in
level 1
Wholesalers in
level 2
Business 1
Retailers
Customers
(100%)
Objects for selling output of A
Pineapple granary
Local traders
Long-distance traders
Businesses
Retailers
Total
Pineapple granary
Long-distance traders
Retailers
Total
Wholesalers in level 1
Retailers
Total
Wholesalers in level 2
Retailers
Businesses
Total
Wholesalers in level 2
Retailers
Total
Retailers
Domestic customers
Total
European customers
Asian customers
Total
Domestic customers
Total domestic customers
Total of export / external
customers
The proportion of
output delivered to
objects (%) (*)
10.95
0.11
71.44
17.22
0.28
100.00
27.27
63.64
9.09
100.00
99.00
1.00
100.00
65.56
11.49
13.14
100.00
82.98
17.02
100.00
90.00
10.00
100.00
80.00
20.00
100.00
100.00
71.29
28.71
The corresponding
proportion of the
value chain (%) (**)
10.95
0.11
71.44
17.22
0.28
100.00
0.03
0.07
0.01
0.11
10.87
0.11
10.89
46.88
13.14
11.49
70.51
59.23
1.85
61.08
50.23
5.67
55.90
22.97
5.74
28.71
65.62
100.00
Source : Survey data, 2014
1
For processing business, the consumption of these stakeholders have been converted to the production of fresh pineapples with an average conversion rate of the
product is: 1 tonne = 4.26 tonnes fresh pineapple
11
Note: * The proportion of output distribution volume is calculated based on the following formula:
Volume sales of the ith stakeholder
th
% distribution of stakeholder A to output the i stakeholder =
x 100%
Total volume inputs of stakeholder A
** The corresponding proportion of the value chain is the rate (%) of the pineapple flow that is consumed through the
stakeholders which is calculated based on the total proportion of pineapple input from previous stakeholders (except
households) which has a weight is a percentage of each product sold stakeholders.
For example:
27.27 x0.11
% pineapple flow of traders sold to pineapple granary =
100
Input
Production
Collector
Processing
0.11%
10.95%
Pineapple
granary
1.85%
10.87%
5.67%
Wholesa
ler in
level 1
9.02%
0.03%
Labor market
(renting
labor)
0.11%
Wholes
aler in
level 2
46.88%
50.23%
Loacal trader
Househo
ld
71.44%
65.62%
Dosmestic
consumer
Retailer
0.01%
0.07%
Agricultural
supplies
dealer
Consuming
Trading
13.14%
Long-distance
trader
Business
11.49%
28.71%
17.22%
Seeding
production
base
European,
Korean,
Japanese
consumers
0.28%
Quyet Thang (winning decision)
cooperation
Extension system
Department of rural development
Investment and trade promotion center
Department of science and technology
Research institute of southern fruit
Credit institutions (Bank for social policies, Bank for agriculture and rural development
Source: Survey data, 2014
Figure 4.1: Diagram of the pineapple value chain in Tien Giang
4.2.2. The key channels in the value chain of pineapple products
Overall, the pineapple value chain in Tien Giang is operated through many
market channels. However, there are 5 major market channels transporting the
volume of products which generated high value added for the whole chain. The
remaining channels were mainly intermediate channels or there was product flow
passing very little. In the fifth primary market channel, channel 1, channel 2 and
channel 3 had an important role, consumed large quantities of fresh pineapple
production in the domestic market. While, channel 4 and channel 5 created products
as processed pineapples and exports.
Channel 1 (households => long-distance traders => wholesalers in level 2 =>
retailers => domestic customers). Channel 1 consumed the most pineapple products
of whole chain. Most households sold pineapples to long – distance traders
(accounting for 71.44%). Then long - distance traders shipped pineapples to the
wholesale market in Ho Chi Minh City (Hoc Mon and Binh Dien market ...). There,
pineapples were distributed for wholesalers in level 2 who came from the districts of
HCMC or from the south eastern provinces by long distance traders (representing
12
46.88%). Wholesalers in level 2 continued to distribute products to retailers at the
“satellite markets” around.
Channel 2 (households => long-distance traders => retailers => domestic
consumers). After harvesting, the pineapple volume of households was sold to long –
distance traders (accounting for 71.44%). Long distance traders not only sold to
wholesalers in level 2, they but also sold directly to retailers (mainly retailers in Ho Chi
Minh City). The amount of long distance traders sold directly to retailers accounted for
13.14% of the total of chain. The retailers would then distribute pineapples to
consumers (at the market, street vendors, and trolleys).
Channel 3 (households => pineapple granary => wholesalers in level 1 =>
wholesalers in level 2 => retailers => domestic customers). Through surveying,
approximately 10.95% of the pineapple output was sold to the pineapple granary.
These pineapple granary focused on some communes of Tan Phuoc district (Hung
Thanh, My Phuoc and Tan Lap 2). The pineapple granary could buy pineapples at the
farm or farmers could also take the pineapple to pineapple granary. The pineapple
granary was built near river or roads to facilitate for big means of transportation
(trucks, boats). Then pineapples were distributed to wholesalers in level 1 (representing
10.87%) to get price fluctuation. Wholesalers in level 1 had transports with large
capacity to buy pineapple pineapple granary. Then they sold pineapples to wholesalers
in level 2 (accounting for 9.02%) at their business place, wholesalers in level 2
continued to distribute to retailers.
Channel 4 (households => long-distance traders => businesses => exports).
Similar to channel 1 and channel 2, traders bought pineapples with high volumes from
farmers. However; there was a difference of product rank from channel 4. It meant that
after collecting the pineapple from farmers, traders classified pineapples into many
different kinds. If most of pineapples were type 1, traders would transport to wholesale
markets in Ho Chi Minh City, the products were type 2 and type 3 were moved to the
processing businesses for consumption (accounting for 11.49%). Sometimes, if
pineapple was low quality (small, ugly shape), long-distance traders would make a
bulk purchase pineapple without classifying.
Channel 5 (households => businesses => exports). Households not only sold
pineapple to pineapple granary and traders; they but also sold directly to processing
enterprises. Volume of pineapples were sold by households to processing enterprises
accounted for 17.22% the total output of the whole chain. When selling pineapples for
processing enterprises, farmers could sell the pineapple with many different levels (due
to businesses were not fussy fruit size). After the collecting, the enterprises would
process pineapple products (canned, frozen, solid) exported to different markets such
as the EU, South Korea, Japan and so on.
4.2.3. The value added and net value added of stakeholders in the key channels of
the value chain
In the primary channels of pineapple product, each stakeholder would like to
generate VAT and regain different net VAT. Table 4.5 indicated the VAT and net VAT of
stakeholders in the major market channels of the pineapple value chain.
13
Table 4.5: The value added and net value added of stakeholders in the major of the
pineapple value chain
Unit: VND/kg
Households
Pineapple
Traders
Wholesalers
Wholesalers
Businesses
Retailers
Items
granary
in level 1
in level 2
Channel 1: households => long - distance traders => wholesalers in level 2 => retailers => domestic customers
Selling price (1)
5,130.93
6,952.62
9,589.33
11,632.28
Intermediate cost (2)
630.97
5,130.93
6,952.62
9,589.33
Value added (3)
4,499.96
1,821.69
2,636.71
2,042.95
Additional cost (4)
1,419.25
548.36
585.07
325.74
Net value added (5)
3,080.71
1,273.33
2,051.64
1,717.21
% net value added (6)
37.93
15.68
25.26
21.14
Channel 2: households => long-distance traders => retailers => domestic customers
Selling price (1)
5,130.93
6,677.70
9,238.80
Intermediate cost (2)
630.97
5,130.93
6,677.70
Value added (3)
4,499.96
1,546.77
2,561.10
Additional cost (4)
1,419.25
548.36
665.74
Net value added (5)
3,080.71
998.41
1,895.36
% net value added (6)
51.56
16.71
31.72
Channels 3: households => pineapple granary => wholesalers in level 1 => wholesalers in level 2 => retailers => domestic
customers
Selling price (1)
5,306.87 6,040.17
6,945.76
9,589.33
11,632.28
Intermediate cost (2)
630.97 5,306.87
6,040.17
6,945.76
9,589.33
Value added (3)
4,675.90
733.30
905.59
2,643.57
2,042.95
Additional cost (4)
1,419.25
359.56
464.14
685.07
325.74
Net value added (5)
3,256.65
373.74
441.45
1,958.50
1,717.21
% net value added (6)
42.03
4.82
5.70
25.28
22.16
Channel 4: households => long-distance traders => businesses => exports (customers) (*)
Selling price (1)
5,130.93
5,530.00
9,344.25
Intermediate cost (2)
630.97
5,130.93
7,676.69(**)
Value added (3)
4,499.96
399.07
1,667.56
Additional cost (4)
1,419.25
267.02
1,325.83
Net value added (5)
3,080.71
132.05
341.73
% net value added (6)
86.67
3.72
9.61
Channel 5: households => businesses => exports (customers) (*)
Selling price (1)
5,050.00
9,344.25
Intermediate cost (2)
630.97
7,196.69(**)
Value added (3)
4,419.03
2,147.56
Additional cost (4)
1,419.25
1,625.83
Net value added (5)
2,999.78
521.73
% net value added (6)
85.18
14.82
Source: Survey data, 2014 Note: (3) = (1) – (2); (5) = (3) – (4); (6) = (5)/𝛴𝑛𝑒𝑡𝑉𝐴𝑇
(*)Channel of low rank consumption was higher than others.
(**)IIncluding material cost (buying pricef) and additives to processed pineapple products
Households: Households were an actor playing production role which created
the first value added for the pineapple in the value chain. VAT due to households
produced in the market channel was quite high, ranging from 4,419.03 to 4,675.90
VND/kg. Channel 3 (sold to pineapple pineapple granary) was a channel which created
the highest VAT. This was the reason that farmers received the highest net VAT as
3,256.65 VND/kg. At channel 4 and channel 5, farmers created VAT and regained
lower net VAT than channels 1, 2, 3 because the pineapples of two channels which
mostly brought the low level were suitable for processing enterprises. When
considering the percentage of net VAT distribution in market channels, farmers were
always the stakeholder received the highest net VAT distribution, ranging from
34.35% to 86.67%.
14
Pineapple granary: was one of the intermediate stakeholders transporting the
quite volume of whole chain. In channel 3, this actor created value added as 733.3
VND/kg and received 373.74 VND/kg net VAT, while the distribution of net VAT of
pineapple granary was 4.82%. The reasons that net VAT and the percentage of net
VAT distribution of pineapple granary were quite low due to specific activities of the
pineapple pineapple granary which only especially transported the product to get
price fluctuation at the time of business.
Long-distance traders: this was a stakeholder which presented at most of
channels of value chain. Long-distance traders brought pineapples to many markets
and distributed them to next actors in the value chain. The range of VAT which traders
created in the channel as from 399.07 to 1821.69 VND/kg; corresponding to net VA,
traders regained from 132.05 to 1273.33 VND/ kg pineapples. If calculated per unit of
product, channel 1 was a channel that long distance traders created the highest value
added and got the most net VAT. Channel 4 was a channel which consumed the
pineapple kinds of low rank, so this also created the lowest value-added channel for
long-distance traders. The rate of net VAT distribution at channel 1 and channel 2 of
long-distance traders was about 16.0%. While at Channel 4, long-distance traders only
got net VAT distribution as 3.72%.
Wholesalers in level 1: A commercial actor played an important role in the
channel 3, wholesaler in level 1 collected pineapple from pineapple granary and
distributed them to the wholesalers in level 2. In this channel, wholesalers in level 1
generated VAT as 905.59VND/ kg and received about net VAT as 441.46 VND/ kg.
Correspondingly, the proportion of net VAt distribution of wholesalers in level 1
received at the channel as 5.7%.
Wholesalers in level 2: as agent’s next long-distance traders and wholesalers in
level 1 and wholesalers in level 2 were also a significant role in distribution activities
towards pineapples to the domestic markets. At channel 1 and channel 3, wholesalers
in level 2 generated VAT respectively 2,636.71 VND/kg and 2,643.57VND/kg and
regained net VAT as 2,051.64VND/kg and 1,958.50 VND/kg. When considering the
percentage of net VAT distribution in market channels, wholesalers in level 2 was an
actor which received high net VAT distribution (after farmers producing pineapples),
equivalent to 25.0%.
Processing enterprises: At channel 4 and channel 5, the enterprises were actors
contributing to increase the additional value for the pineapples through processing
operations and exports. At Channel 4, the value added created by businesses calculated
per unit’s products as 1,667.56 VND/kg and received net VAT as 341.73 VND/ kg, the
percentage of net VAT distribution of business in this channel was 9.61%. While at
channel 5, businesses generated VAT as 2,147.56 / kg and received about net VAT as
521.73 VND/kg and the proportion of net VAT distribution of business received
14.82%. Thus, collecting pineapples from farmers helped businesses create the value
added and get the net VAT better.
Retailers: In the domestic market, retailers were actors that could bring fresh
pineapples to consumers. In the market channels, VAT created ranges from 2,042.95 to
2,561.10 VND/kg and received net VAT respectively from 1,717.21 to 1,895.36
VND/kg pineapples. In particular, channel 2 was a channel that retailers generated the
15
highest added value and get the most net VAT. Correspondingly, the proportion of net
VAT distribution also was the highest with a value of 31.72%. This suggested that, if
reduced commercial intermediaries, retailers would increase profitability and improve
the rate of profit distribution.
4.2.4. The net value added and allocation of the net value added of the poor and
non-poor in the key channels
In each market channel of the pineapple value chain, the poor and non-poor
households received net VAT and the percentage of net VAT distribution were very
different. The difference of net VAT and the rate of allocation between 2 groups were
shown in Table 4.6 below.
Table 4.6: Net value added and Net value added distribution of the poor and non-poor
in the pineapple value chain
The key
market
channels
Channel 1
Channel 2
Channel 3
Channel 4
Channel 5
Unit: VND/kg
Non-poor households
Poor households
VAT
(VND)
4,233.75
4,233.75
4,170.89
4,300.40
4,219.38
Net
VAT(VND)
The proportion of
distribution (%)
2,582.36
2,582.36
2,519.50
2,649.01
2,567.99
32.04
29.70
32.37
80.73
79.06
VAT
(VND)
Net
VAT(VND)
4,732.49
4,732.49
4,832.29
4,689.88
4,609.03
3,490.96
3,490.96
3,590.76
3,448.35
3,367.50
The proportion of
distribution (%)
40.87
38.04
43.34
84.05
89.26
Source: Survey data, 2014
In channel 1 and channel 2, the poor received 2,582.36 VND/ kg when they sold
pineapples for long-distance traders. Although net VAT of poor households received as
the same as for selling long-distance traders in channel 1 and channel 2 , the percentage
of net VAT distribution that poor households received was different from the market
channel 1 (32.04%) market and channel 2 (29.7%). Net VAT of poor households in the
channel 3 when sold to pineapple granary as 2,519.5 VND/ kg, this value was lower
than the channel 1 and channel 2, but the percentage of net VAT distribution of the
channel was higher than both channel 1 and channel 2, the ratio was 32.37%. In market
channels 4 and 5 (channel of export market), poor households received VAT equivalent
to channel 1, 2 and 3, however, the percentage of net VAT distribution was received
which was highest (from 79.06 % to 80.73%). Thus, the the Net VAT of channel export
market improved, the poor would receive as much net VAT distribution. Compared net
VAT and he rate of net VAT distribution between the non-was always higher than than
the poor. The difference of net VAT between non-poor was higher than the poor around
1,000 VND/ kg and net VAT distribution rate equivalent to 10% in almost all market
channels. The main reason to make up the difference in VAT and net VAT in pineapple
production activities between the poor and non-poor households due to: (i) Input: Due
to limited financial human conditions so the poor selected the poor quality inputs as
well as farming followed the habitual which didn’t focus on the scientific mode of
production. It led to cause waste of inputs and lead to low productivity. (ii) Outputs:
Conditions for farming position were less favorable compared to non-poor households,
the ability to negotiate lower decision, so the poor have sold products without high
price. The cause has made the poor create added value and get net VAT always
regained lower than the non-poor.
16
4.2.5. The value added and the value added allocation of actors in the pineapple
product value chain
Table 4.7 showed that farmer was the actor that created the highest value added
with 4,515.67 VND/kg, corresponding to 30.78% of the whole chain. Thanks to the
activities of classification, wholesalers in level 2 is the second actor which is the
highest value added generated in the value chain, with 2,641.70 VND/kg,
corresponding to 18.01% of the total value added of the chain. Local traders created
the lowest VAT which was 503.90 VND/kg accounting for only 3.43% of the value
added of the chain. With the intermediate costs in the whole chain was higher VAT
generated by actors showed that collection, trading and processing of the chain was
not really effective, these agents can not raise VAT by measures expanding between
input costs and output prices, especially in processing.
Table 4.7: The value added and distribution of the value added of actors in the
pineapple value chain
Unit: VND/kg
Households
LongBusinesses Wholesalers Wholsalers Retailers
distance
in level 1
in level 2
traders
Selling price (1)
5,146.64 5,653.90 6,040.17
6,548.82
9,344.25
6,945.76
9,589.33 11,032.28
Intermediate cost (2)
630.97 5,150.00 5,306.45
5,085.27
7,388.69
6,040.17
6,947.63
9,082.24
Value added (3)
4,515.67
503.90
733.72
1,463.54
1,955.56
905.59
2,641.70
1,950.04
% value added (4)
30.78
3.43
5.00
9.98
13.33
6.1
18.01
13.29
Prepaid cost (5)
1,419.25
343.74
359.56
548.36
1,475.83
464.14
635.07
365.74
% prepare cost (6)
25.29
6.13
6.41
9.77
26.30
8.27
11.32
6.52
Net value added (7)
3,096.42
160.16
374.16
915.18
479.73
441.45
2,006.63
1,584.30
% net value added (8)
34.18
1.77
4.13
10.10
5.30
4.87
22.15
17.49
Total costs (9)
2,050.22 5,493.74 5,666.01
5,633.63
8,864.52
6,504.31
7,582.70
9,447.98
Profits/costs (10)
1.51
0.03
0.07
0.16
0.05
0.07
0.26
0.17
Source: Survey data, 2014 Note: (3) = (1) – (2); (4) = (3)/𝛴𝐺𝑇𝐺𝑇; (6) =(5)/𝛴𝐶𝑃𝑇𝑇; (7) = (3) – (5);
(8) =(7)/𝛴𝐺𝑇𝐺𝑇𝑇; (9) = (2) + (5); (10) = (7)/(9)
Items
Local Pineapple
traders granary
In other aspects, the net VAT was generated in the whole chain and net VAT
of each actor gained corresponding with production efficiency/business of each actor.
Farmers and wholesalers in level 2 were actors got net VAT and there were high
production efficiency/business in the chain. Total net VAT of chain was 9,058.03
VND/kg, which the net VAT of households contributing as 3,096.42 VND,
accounting for 34.18%. Overall, net VAT of actors got positive. The research results
also showed that the actor had high net VAT; output of production/business was low.
Therefore; when assessing investment performance, we need to consider two criteria
was: capital cycle and actual volume of pineapple. This issue will be discussed at the
contents 4.2.6.
4.2.6. Compare investment performance among the actors who involved in the
value chain
The results of the analysis (the 4.8) showed that, farmers are actors which had
profit margin/highest costs, including non-poor households had profit margin/higher
cost nearly 2 times the poor. With 1 VND investment costs, poor households
generated 1.12 VND profit, while non-poor households generated 1.9 VND. In
commercial actors, wholesaler in level 2 was an actor which had profit
margin/highest cost. However, in order to assess the exact the efficiency of
investment in business/production of each actor, it needed to consider yielding / year
and pineapple production volume / transaction in the year of each agent. According to
17
the calculation results (Table 4.8), although farmers were actors that created profit
margins / highest cost but recorded only once in the first year of capital. While other
actors have some capital cycle times greater than households. Moreover, with the
huge volume of transactions, the commercial actors were subjected to effective
operation than farmers many times.
Table 4.8: investment efficiency of actors involved in the pineapple value chain
Profit
margin
1.12
1.90
0.16
0.03
0.07
0.05
0.07
0.26
0.17
Objects
Poor households
Non-poor households
Long-distance traders
Local traders
Pineapple granary
Businesses
Wholesalers in level 1
Wholesalers in level 2
Retailers
Number of capital
cycle/year(1)
1
1
60
75
92
4
84
60
60
Volume
(ton/year)
12.18
30.39
2,177.55
1,404.12
2,606.99
17,807.16
2,180.42
113.67
43.56
Rate of
return/year(2)
1.12
1.90
9.60
2.25
6.44
0.20
5.88
15.60
10.20
Source: Survey data, 2014
(1) number of capital cycle/year = number of operating days in he year /number of days capital cycle
(2) rate of return/year = profit margin * number of capital cycle/year
4.2.7. Compare the pineapple value added of the poor and non – poor in the value
chain
The testing results on the VAT difference between the poor and non-poor
households showed that the difference had statistical significance of VAT and net
VAT. The VAT of Pineapple product was created larger other by non-poor about 500
VND/kg and net VAT of non-poor households received which was higher than poor
households about 1,000 VND/kg. Indeed, a production resource of poor households
was limited. Lack of financial advantages makes the poor lose negotiating power
when buying inputs. Buying agricultural materials with paying at different times
making use of price inputs rise. Lower selling prices with higher production costs, it
was the cause to the added value created on the low product and net VAT rregained
to be lower.
Table 4.9: Compare the pineapple value added of poor households and non-poor
households
Indicators
Unit
Selling price
Intermediate cost
Value added
Prepaid cost
Net value added
VND/kg
VND /kg
VND /kg
VND /kg
VND /kg
Poor
households
Non-poor
households
4,894.97
672.12
4,222.85
1,651.39
2,571.46
5,339.32
599.47
4,739.85
1,241.53
3,498.32
The level of The level of
significance significance
testing
testing t*
Levene*
0.001
0.000
0.251
0.068
0.040
0.000
0.365
0.000
0.073
0.000
Source: Survey data, 2014
*Note: The test results with confidence level 95%, corresponding to the level of significance α=5%
18
- Xem thêm -