International Journal of Food Microbiology 203 (2015) 15–22
Contents lists available at ScienceDirect
International Journal of Food Microbiology
journal homepage: www.elsevier.com/locate/ijfoodmicro
Short communication
Bacterial community dynamics and metabolite changes in
myeolchi-aekjeot, a Korean traditional fermented fish sauce,
during fermentation
Se Hee Lee, Ji Young Jung, Che Ok Jeon ⁎
Department of Life Science, Chung-Ang University, Seoul 156-756, Republic of Korea
a r t i c l e
i n f o
Article history:
Received 13 November 2014
Received in revised form 7 February 2015
Accepted 25 February 2015
Available online 3 March 2015
Keywords:
Fermented fish sauce
Myeolchi-aekjeot
Anchovy
Bacterial community dynamics
Metabolites
Tetragenococcus
a b s t r a c t
Myeolchi-aekjeot (MA) is a Korean traditional fish sauce, made by fermenting salted [approximately 25% (w/v)]
anchovies. Three sets of MA samples, S-MA, M-MA, and L-MA, were prepared using small (5–8 cm), medium
(8–10 cm), and large (10–13 cm) anchovies, respectively, and their bacterial communities and metabolites
were investigated for 280 days. Bacterial community analysis using pyrosequencing revealed that, in S-MA, the
initially dominant genera, including Phychrobacter, Photobacterium, and Vibrio, disappeared rapidly and
Salinivibrio, Staphylococcus, and Tetragenococcus/Halanaerobium appeared sequentially as the major populations.
In contrast, in M-MA and L-MA, the initially dominant genera were maintained relatively well during the early
fermentation period, but eventually Tetragenococcus became predominant without the growth of Halanaerobium.
The changes in the bacterial community occurred more quickly in MA prepared with smaller anchovies than in
those prepared with larger anchovies. Metabolite analysis using 1H NMR showed that amino acids, glycerol,
acetate, and lactate rapidly increased in all MA samples during the early fermentation period. Amino acids
increased more quickly and then decreased after reaching their maximum level in S-MA, while they increased
continually until the end of fermentation in L-MA. This suggests that the complete fermentation of L-MA may
require more time than that for S-MA. A correlative analysis between bacterial communities and metabolites
revealed that the increase in acetate, butyrate, and putrescine in S-MA was associated with the growth of
Halanaerobium, which may be a useful indicator of anchovy sauce quality.
© 2015 Elsevier B.V. All rights reserved.
1. Introduction
Fish sauces are clear brown liquids with a salty taste and a distinctive
fish flavor that are generally made by spontaneous long-term fermentation (more than 6 months) of salted whole small fish (e.g., anchovy and
sand eel) (Fukui et al., 2012; Lopetcharat et al., 2001). Myeolchi-aekjeot
(MA), a Korean traditional fermented fish sauce, is made by a long-term
fermentation of salted anchovies. It has been known that anchovy
(called myeolchi in Korean, Engraulis japonicus) has an average life
span of 1.5 years and grows up to 15 cm in length and contains different
amounts of protein, lipid, and carbohydrate depending on their size,
which suggests that MA fermentation may be different depending on
the size of anchovies.
The naturally occurring fermentation of fish sauces without starter
cultures leads to the growth of various halophilic or halotolerant microbes due to their high salt conditions (Fukui et al., 2012; Udomsil
et al., 2010). So far, various bacteria including Achromobacter, Bacillus,
⁎ Corresponding author at: Department of Life Science, Chung-Ang University, 84,
HeukSeok-Ro, Dongjak-Gu, Seoul 156-756, Republic of Korea. Tel.: +82 2 820 5864;
fax: +82 2 825 5206.
E-mail address:
[email protected] (C.O. Jeon).
http://dx.doi.org/10.1016/j.ijfoodmicro.2015.02.031
0168-1605/© 2015 Elsevier B.V. All rights reserved.
Halomonas, Micrococcus, Brevibacterium, Halobacterium, Vibrio,
Flavobacterium, Staphylococcus, and Tetragenococcus species have been
identified in fish sauces by mainly culture-dependent approaches
despite the presence of many uncultivable microbes (Fukui et al.,
2012; Guan et al., 2011; Lopetcharat et al., 2001; Taira et al., 2007).
Culture-independent approaches based on clonal analysis of 16S rRNA
genes have been also applied to investigations of microbial communities of fish sauces (Chuon et al., 2014; Kim and Park, 2014), but these
approaches have limitations in ascertaining microbial community
dynamics during fermentation as they tend to be time-consuming,
laborious, and hence relatively low throughput. Therefore, highthroughput pyrosequencing has been extensively applied to better
understand the microbial community dynamics of fermented foods
(Humblot and Guyot, 2009; Jung et al., 2013; Lee et al., 2014a; Roh
et al., 2010; Sakamoto et al., 2011).
Fish tissues are hydrolyzed by endogenous enzymes originated in
the fish as well as exogenous enzymes derived from microbes during
the fermentation of fish sauces (Jung et al., 2013; Yongsawatdigul
et al., 2007). Therefore, studies of the microbial dynamics as well as
the metabolite changes are indispensable to understand fermentation
processes of fish sauces because the metabolites reflect collective
phenotypic results of microbial communities and endogenous enzymes
16
S.H. Lee et al. / International Journal of Food Microbiology 203 (2015) 15–22
(Ercolini et al., 2011, 2013; Lee et al., 2014a). Studies on both the microbial communities and the metabolite changes during MA fermentation
are very important to gain a better understanding of MA fermentation.
However, to the best of our knowledge, to date, no simultaneous studies
on the microbial community dynamics and metabolite changes during
MA fermentation have been performed.
1
H NMR is a very comprehensive, relatively easy, and nondestructive
method for the simultaneous analysis of multiple metabolites present in
fermented foods. A combination of pyrosequencing and 1H NMR
approach has been suggested to be one of the more powerful ways to
better understand the relationships between the microbial community
dynamics and metabolite changes during food fermentation (Jeong
et al., 2013; Jung et al., 2013, 2014; Lee et al., 2014a, 2014b). Because
fermented salted seafood is usually made by fermentation under highly
salted [20–30% (w/w)] conditions, it has been hypothesized that
archaea may contribute to salted seafood fermentation (Roh et al.,
2010; Tapingkae et al., 2010). However, recent reports have shown
that archaea may not play an important role in salted seafood fermentation (Jung et al, 2013; Lee et al., 2014a). Therefore, in this study, three
sets of MA samples were prepared using anchovies of different sizes
and a combination of pyrosequencing and 1H NMR was applied to
investigate bacterial succession and metabolite changes during MA
fermentation.
2. Material and methods
2.1. Preparation of myeolchi-aekjeot samples and analysis
Three sets of myeolchi-aekjeot (MA) samples with approximately
25% (w/v) salt concentration were prepared in triplicate using anchovies (E. japonicus) of different lengths (5–8 cm, small (S); 8–10 cm,
medium (M); 10–13 cm, large (L)) as described previously (Jung et al.,
2013; Lee et al., 2014a). Because the average size of anchovies harvested
from Korean waters depends on the fishing season, the three sets of MA
samples were prepared independently at different times of the year. The
crude protein, carbohydrate, and lipid contents of the anchovies were
measured according to their standard analysis methods (MFDS, 2013).
For the preparation of triplicated MA samples, fresh anchovies and
solar salts (Shinan, Korea) were equally dispensed into three plastic
containers to include 10-kg and 2.7-kg portions, respectively, and then
4 l of 25% (w/v) solar salt solution was added into each container to
completely cover the anchovies. The triplicated three sets of MA samples (S-MA, M-MA, and L-MA) were incubated at 25 °C and their pH
values were monitored. Four milliliters of supernatants (liquid fraction
of MA) was intermittently sampled from each container and microorganisms were harvested by centrifugation (8000 rpm for 20 min at
4 °C). Microorganisms harvested from the triplicated samples were
combined and stored at −80 °C until the bacterial community analysis.
The centrifugation supernatants were stored separately at −80 °C for
respective metabolite analysis. Bacterial abundances in MA samples
were estimated using quantitative PCR (qPCR) according to a previously
described method (Lee et al., 2014a). NaCl concentrations in MA samples were measured according to the Mohr method (AOAC, 2000).
2.2. Barcoded pyrosequencing and data processing
Total genomic DNA extraction from MA samples, barcoded
pyrosequencing of bacterial 16S rRNA genes, and data processing of
sequencing reads were conducted according to the procedure described
previously (Lee et al., 2012). Taxonomic classifications of high-quality
reads were performed using the RDP naïve Bayesian rRNA Classifier
2.6 (Wang et al., 2007) at an 80% confidence threshold. Rarefaction
analysis and calculation of operational taxonomic units (OTU),
Shannon–Weaver and Chao1 richness indices, and evenness were
performed using the RDP pyrosequencing pipeline (http://pyro.cme.
msu.edu/) (Cole et al., 2014). To compare the bacterial communities
among the MA samples, weighted hierarchical clustering analysis and
principal coordinate analysis (PCoA) were performed according to the
procedure described previously (Lee et al., 2012).
2.3. Metabolite analysis using 1H NMR and redundancy analysis
Metabolite analysis in MA samples using 1H NMR and redundancy
analysis (RDA) for bacterial community and metabolite changes using
the vegan package (Oksanen et al., 2011) in the R programming
environment (http://cran.r-project.org/) were conducted according to
the procedure described previously (Jung et al., 2013).
2.4. Pyrosequencing data accession number
The pyrosequencing data of the 16S rRNA genes are publicly
available in the NCBI Short Read Archive (SRA) under accession no.
SRX755990.
3. Results
3.1. Compositions of differently sized anchovies
The crude protein, crude carbohydrate, and total lipid contents of
anchovies of the three different size ranges used for the preparation of
three sets of MA samples were measured in triplicate (Table 1). The
average crude protein content ranged between approximately 17.6
and 19.7 g/100 g fresh anchovy. The crude carbohydrate content was
higher in the large anchovies (approximately 1.1 g/100 g fresh anchovy)
than in small and medium anchovies, both of which were approximately 0.6 g/100 g fresh anchovy. The total lipid content was quite different
depending on the anchovy size. The total lipid contents of the large
anchovies were approximately 6.0 g/100 g fresh anchovy, while
those of small and medium anchovies were approximately 1.5 and
3.7 g/100 g fresh anchovy, respectively.
3.2. General features of MA fermentation
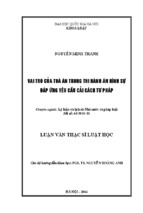
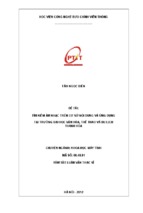
The NaCl concentrations were nearly constant, approximately
24.8 ± 0.6% (w/v), in all MA samples during the entire fermentation
period. The initial pH values of the MA samples were in the range of
5.75–6.01 and the pH values were relatively constant until 50 days of
fermentation in all MA samples (Fig. 1A). The pH of the M-MA and LMA samples remained relatively constant until the end of fermentation,
while that in S-MA increased rapidly to the highest value of approximately pH 6.5 at 170 days, and then decreased to approximately
pH 6.2 (day 280).
The initial bacterial 16S rRNA gene copy number in the MA samples
was inversely related to anchovy size (Fig. 1B). The initial bacterial 16S
rRNA gene copy numbers in S-MA, M-MA, and L-MA were approximately 1.2 × 10⁸, 3.1 × 10⁷, and 7.1 × 10⁶ copies/ml, respectively. The copy
number in S-MA increased starting from the early fermentation
period without a lag phase, while that in the larger anchovies, particularly L-MA, was relatively constant during the early fermentation
period. The copy numbers in M-MA and L-MA increased after approximately 60 and 80 days, respectively.
The 16S rRNA gene copies were higher in MA samples prepared with
smaller anchovies than in those prepared with larger anchovies during
the entire fermentation period. The bacterial 16S rRNA gene copy
number in S-MA increased to its highest value of approximately
9.5 × 10⁹ copies/ml at 170 days, whereas the highest copy numbers
observed in M-MA and L-MA were approximately 3.4 × 10⁹ and
4.5 × 10⁸ copies/ml, respectively. The bacterial 16S rRNA gene copy
number in S-MA was approximately 2 orders of magnitude higher
than that in L-MA.
S.H. Lee et al. / International Journal of Food Microbiology 203 (2015) 15–22
17
Table 1
Compositions (%) of small, medium, and large anchovies used for the preparation of three myeolchi-aekjeot samples.
Anchovies (fishing time)
Range of length (cm)
Range of weight (g)
Average content ± SDa
Moisture
Total proteins
Total carbohydrate
Lipids
Ash
Small (Aug. 2011)
Medium (Aug. 2011)
Large (Jan. 2012)
5–8
8–10
10–13
2–5
5–10
10–16
74.9 ± 0.3
72.3 ± 0.3
72.3 ± 0.4
18.9 ± 0.2
19.7 ± 0.3
17.6 ± 0.2
0.6 ± 0.1
0.6 ± 0.1
1.1 ± 0.2
1.5 ± 0.1
3.7 ± 0.2
6.0 ± 0.2
4.1 ± 0.2
3.7 ± 0.2
3.0 ± 0.2
a
The contents were measured in triplicate and SD represents standard deviation.
3.3. Bacterial diversity changes in MA samples during fermentation
A total of 159,701 pyrosequencing reads for bacterial 16S rRNA
genes were generated from 39 samples (three sets of MA
samples × 13 samplings). After the removal of low-quality, chimeric,
and Streptophyta (plant) 16S rRNA gene sequences, a total of 130,727
high-quality bacterial reads, with a 462-bp average read length and an
average of 3,351 reads per sample, were obtained. The rarefaction
curves showed that the bacterial diversities increased during the early
MA fermentation period in all three sample sets (Supplementary
Fig. S1). After their initial increases, the bacterial diversities decreased
and approached their respective asymptotes as the fermentation
progressed. The bacterial diversities increased again during the end of
the fermentation period. The bacterial diversity changes occurred
more quickly in the MA samples of smaller anchovies, especially in SMA, than those of larger anchovies. Although the number of sequencing
reads affected statistical diversity indices including OTU, Shannon–
Weaver, Chao1, and evenness, the diversity indices were also in good
Fig. 1. Changes in pH (A) and total bacterial 16S rRNA gene copy numbers (B) during
fermentation of myeolchi-aekjeot samples prepared with small (S-MA), medium
(M-MA), and large (L-MA) anchovies.
agreement with the rarefaction analysis results (Supplementary
Table S1).
3.4. Bacterial community changes in MA samples during fermentation
The bacterial sequencing reads were classified at the phylum
and genus levels. At the phylum level, Proteobacteria and Firmicute
were predominant in all MA samples during the entire fermentation
period (Supplementary Fig. S2), which is consistent with previous
reported results for other fermented salted seafood (Jung et al., 2013;
Lee et al., 2014a, 2014b). Proteobacteria was initially predominant,
but was rapidly replaced with Firmicutes as the fermentation
progressed. The replacements occurred earlier in the MA made with
smaller anchovies, especially in S-MA, than larger anchovies. At
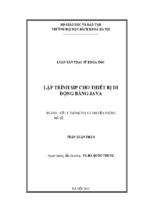
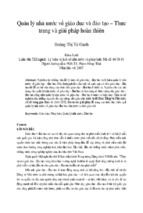
the genus level, Photobacterium, Vibrio, Phychrobacter, unclassified
Gammaproteobacteria, and unclassified Alteromonadales, which might
be primarily derived from raw anchovies, were identified in all initial
MA samples (day 0), although their relative abundances depended on
the anchovy size (Fig. 2). In S-MA, the initially dominant genera
disappeared rapidly within only 5 days, and Salinivibrio became the
predominant genus, followed by Staphylococcus; after 30 days of
fermentation, Tetragenococcus became predominant until the end of
fermentation. Halanaerobium, the growth of which was trivial or not
detectable in M-MA and L-MA, also became relatively predominant
after 80 days of fermentation. In M-MA, Phychrobacter, which was a
major genus in the initial samples, was still maintained as a predominant group until 60 days of fermentation, but Tetragenococcus became
predominant after 80 days of fermentation. In L-MA, the initial bacterial
community was relatively stable until 80 days of fermentation without
predominance by a particular genus, and Tetragenococcus became
predominant after 100 days of fermentation. In conclusion, the bacterial
successions were quite different depending on the anchovy size during
the early fermentation period, but eventually Tetragenococcus predominated regardless of the anchovy size.
To more rigorously evaluate the results presented above for the
bacteria community changes in the MA samples during the fermentation period, hierarchical clustering analysis and PCoA were performed
using all high-quality sequencing reads. The bacterial communities in
the MA samples during the early fermentation period were distinctly
clustered depending on the size of the anchovy used to prepare
the MA, but they were grouped more coherently during the end of
fermentation (Supplementary Fig. S3A); this is consistent with the
predominance of Tetragenococcus in all MA samples during the end of
fermentation shown in Fig. 2. However, the S-MA samples were slightly
more distantly clustered from those of M-MA and L-MA, suggesting that
their corresponding bacterial communities were different during the
end of fermentation, which also explains the presence of Halanaerobium
in S-MA as shown in Fig. 2. The bacterial community changes shown in
the bacterial classification (Fig. 2) and hierarchical clustering analysis
(Supplementary Fig. S3A) during the fermentation were also confirmed
by PCoA (Supplementary Fig. S3B). The PCoA results also show that
the bacterial community changes occurred more rapidly in S-MA than
in M-MA and L-MA and they progressed differently during the early fermentation period depending on the size of anchovy used to prepare the
MA, but eventually became similar during the end of fermentation. The
data plots showing the bacterial community changes shifted steadily
18
S.H. Lee et al. / International Journal of Food Microbiology 203 (2015) 15–22
Fig. 2. Bacterial taxonomic compositions at the genus level of myeolchi-aekjeot samples prepared with small (S-MA), medium (M-MA), and large (L-MA) anchovies during fermentation.
Others are composed of the phyla or the genera, each showing a percentage of reads b2.0% of the total reads in all samples of each panel.
from day 0 to day 60 in S-MA, while the data plots in M-MA and L-MA
shifted very quickly after 60 and 80 days, respectively, which is consistent with the bacterial abundance profiles (Fig. 1B), the rarefaction
curves (Supplementary Fig. S1), and the bacterial community changes
(Fig. 2). The PCoA results also show that the S-MA samples were
separated from M-MA and L-MA during the late fermentation period,
as shown in the hierarchical clustering analysis (Supplementary
Fig. S3A).
3.5. Metabolite changes in MA during fermentation
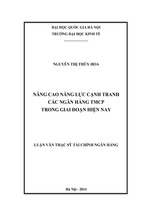
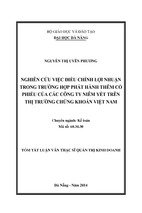
The metabolite analysis shows that amino acids were the major
metabolites in the MA samples (Fig. 3). The concentrations of amino
acids increased rapidly in all MA samples during the early fermentation
period, but their overall profiles during the entire fermentation period
were slightly different depending on the anchovy size. The concentrations of amino acids including arginine, aspartate, glutamate, glycine,
and lysine decreased after reaching their maximum level during
the end of fermentation in the MA prepared with smaller anchovies,
especially in S-MA, while the concentrations of amino acids in L-MA
increased continually until the end of fermentation, suggesting that
more time may be required to accomplish the complete fermentation
of L-MA than that required for the fermentation of S-MA.
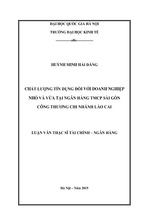
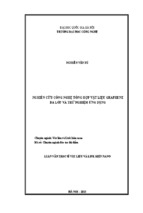
Glucose, glycerol, acetate, butyrate, lactate, and putrescine were also
identified as the primary organic compounds during the MA fermentation (Fig. 4). The concentration of glucose, which might be derived from
anchovy glycogen, increased quickly in L-MA during the initial fermentation period and its maximum level was much higher than that in SMA and M-MA, which is consistent with the high carbohydrate content
of large anchovies as shown in Table 1. The glucose concentration
gradually decreased in all MA samples after an initial increase
(Fig. 4A). The concentration of glycerol, which might be derived from
the hydrolysis of lipid, increased quickly during the early fermentation
period in all MA samples (Fig. 4B). The glycerol concentration increased
S.H. Lee et al. / International Journal of Food Microbiology 203 (2015) 15–22
19
Fig. 3. Changes in major amino acids and nitrogen compounds identified by 1H NMR in myeolchi-aekjeot samples prepared with small (S-MA), medium (M-MA), and large (L-MA) anchovies during fermentation. Data are presented as average values ± standard deviations in triplicate.
until the end of fermentation in M-MA and L-MA, while it decreased in
S-MA after 80 days. The glycerol concentration was significantly higher
in the MA prepared with larger anchovies than smaller anchovies,
which is consistent with the lipid content of the three size anchovy
groups as shown in Table 1. The concentrations of acetate, which
might be derived from the fermentation or hydrolysis of carbohydrates
(glucose) or lipids, increased rapidly in all MA samples as the fermentation progressed. Interestingly, the acetate concentrations were higher in
the MA prepared with smaller anchovies, although their carbohydrate
(glucose) and lipid concentrations were much lower compared to
those of the larger anchovies (Fig. 4C). The concentrations of butyrate
were relatively low during the entire fermentation period, but slightly
increased in S-MA during the end of fermentation (Fig. 4D). Lactate
was identified in MA samples as the major organic acid (Fig. 4E). The
lactate levels were relatively constant during the early fermentation
period, but they began to increase during the middle fermentation
period. The lactate increase occurred earlier in the MA prepared with
smaller anchovies. Biogenic amines that are mainly produced by the
microbial decarboxylation of amino acids or other nitrogen compounds
in foods are important indicators of the quality of fermented seafoods
(Halász et al., 1994). Putrescine was detected only in the S-MA samples
(Fig. 4F) and its level increased rapidly after 45 days of fermentation.
However, other biogenic amines including histamine, tyramine, and
cadaverine were not detected in any MA samples.
3.6. Multivariate statistical analysis
To statistically assess the changes in metabolites and bacterial
abundances during MA fermentation, an RDA was performed on the
basis of bacterial abundances at the genus level (Fig. 2) and metabolite
concentrations (Figs. 3 and 4). The RDA triplot showed that the fermentation processes were different depending on the size of anchovy used
for the preparation of MA, and the production of putrescine in S-MA
might be related to the growth of Halanaerobium during the end of
the fermentation period (Fig. 5).
4. Discussion
The fact that anchovies of various sizes are used for the production
of MA and the compositions of anchovies vary according to size
(Table 1) suggests that fermentation properties including pH, bacterial
abundance, and bacterial community and metabolite changes may be
different depending on the size of anchovy used for the preparation of
MA. However, to the best of our knowledge, no study has investigated microbial community dynamics and metabolite changes during the entire
fermentation period in MA prepared with anchovies of different sizes.
Bacterial community analysis revealed that in S-MA Salinivibrio,
Staphylococcus, and Tetragenococcus/Halanaerobium appeared
20
S.H. Lee et al. / International Journal of Food Microbiology 203 (2015) 15–22
Fig. 4. Changes in major organic compounds [glucose (A), glycerol (B), acetate (C), butyrate (D), lactate (E), and putrescine (F)] identified by 1H NMR in myeolchi-aekjeot samples prepared with small (S-MA), medium (M-MA), and large (L-MA) anchovies during fermentation. Data are presented as average values ± standard deviations in triplicate.
sequentially as the major populations with the rapid disappearance of
the initially dominant genera as the fermentation progressed, while in
M-MA and L-MA the initially dominant genera were relatively stable
until Tetragenococcus appeared as the predominant genus (Fig. 2).
Fig. 1B shows that the bacterial abundances in S-MA increased
from the early fermentation period without a lag phase, while the
bacterial abundances in M-MA and L-MA began to increase after approximately 60 and 80 days of fermentations, respectively, which is
consistent with the predominance of Tetragenococcus. These results
suggest that in S-MA the growth of Salinivibrio, Staphylococcus, and
Tetragenococcus/Halanaerobium occurred evidently during the fermentation, whereas in M-MA and L-MA bacterial growths during
fermentation was negligible except for Tetragenococcus. Furthermore,
the growth of the initially dominant genera, Photobacterium, Vibrio,
and Phychrobacter that may include some pathogenic strains (López
et al., 2012) did not occur, although they remained dominant until
Tetragenococcus became abundant.
The formation of amino acids through the proteolysis of proteins
during fish fermentation is a very important aspect of MA production
because amino acids are closely related to the taste (umami) and flavor
of fermented seafood (Mok et al., 2000; Özden, 2005). The concentration of amino acids increased rapidly even in M-MA and L-MA with
low abundances and trivial growth of bacteria during the early fermentation period (Fig. 3), which is consistent with previous results using
S.H. Lee et al. / International Journal of Food Microbiology 203 (2015) 15–22
21
Fig. 5. A redundancy analysis (RDA) showing correlations among myeolchi-aekjeot samples, relative bacterial abundances, and metabolite concentrations during fermentation of
myeolchi-aekjeot samples prepared with small (S-MA), medium (M-MA), and large (L-MA) anchovies. Numbers beside the symbols represent the fermentation time (days). The
directions and lengths of the dotted straight arrows indicate the influence of the bacterial population on the myeolchi-aekjeot samples. The thick arrows indicate the routes of
myeolchi-aekjeot fermentation on the RDA triplot.
fermentation of other types of salted seafood (Jung et al., 2013; Lee et al.,
2014a and b). These results suggest that the increase in amino acids
during the early MA fermentation might be more closely associated
with endogenous enzymes than bacterial proteinases, which is
consistent with previous reports showing that bacterial proteinases
have low activities in high-salt conditions (Guan et al., 2011; Nam
et al., 1998). However, it is clear that the bacterial populations
had influenced the changes in other metabolites during the MA fermentation including glucose, acetate, lactate, and putrescine as shown in
Fig. 4.
Our previous studies showed that Halanaerobium is a potential
indicator of putrefaction or over-fermentation of fermented salted
seafood because members of Halanaerobium are responsible for the
production of acetate, butyrate, and biogenic amines through the
fermentation of monosaccharides, amino acids, and glycerol (Jung
et al., 2013; Lee et al., 2014a; Lee et al., 2014b). The carbohydrate and
lipid contents were lower in S-MA than in M-MA and L-MA (Table 1)
and as a result, the concentrations of glucose and glycerol were also
lower in S-MA than in M-MA and L-MA (Fig. 4A and B). However, the
concentrations of acetate and butyrate in S-MA were higher during
the end of fermentation than those in M-MA and L-MA (Fig. 4C and
D), which might be related to the growth of Halanaerobium. Putrescine,
which is formed through the decarboxylation of ornithine, increased
rapidly in S-MA, which is in good agreement with the growth of
Halanaerobium (Fig. 5). These results indicate that Halanaerobium
might be responsible for the production of acetate, butyrate, and
putrescine during MA fermentation and the growth of Halanaerobium
could be considered an important indicator of anchovy sauce
quality. Brown et al. (2011) reported that a Halanaerobium species,
Halanaerobium hydrogenifirmans, harbors an ornithine decarboxylase
gene, suggesting that Halanaerobium species may be responsible for
the putrescine production. The pH increased in S-MA as the fermentation progressed (Fig. 1A), which might be related to the production of
putrescine, suggesting that the pH profile is also a potential indicator
of the production of biogenic amines.
Previous studies have also shown that members of Tetragenococcus,
which are halophilic lactic acid bacteria, have been detected in various
fermented seafood as the major population and they play important
roles in taste and flavor enhancement of fish sauces during fermentation
(Chen et al., 2006; Fukami et al., 2004; Kim and Park, 2014; Kobayashi
et al., 2000; Kuda et al., 2012; Thongsanit et al., 2002; Udomsil et al.,
2011). The concentration of lactate, which might be released from the
muscles of raw anchovies, increased very quickly during the initial
fermentation period (Fig. 4E), and increased again after the middle
fermentation period, which is consistent with the growth of
Tetragenococcus. Although the bacterial community changes were
quite different depending on the anchovy sizes during the early fermentation period in this study, eventually Tetragenococcus became predominant regardless of anchovy sizes during the end of fermentation
(Fig. 2). Therefore, this study also suggests that Tetragenococcus could
be a good bacterial starter to improve the taste and flavor characteristics
of myeolchi-aekjeot.
This is the first study to investigate bacterial community dynamics
and metabolite changes during the entire Korean fish sauce fermentation. However, additional studies regarding the relationships among
microbial communities, metabolites, and sensory characteristics (taste,
flavor, and food safety) and the effects of fermentation conditions
(e.g., temperature, salt concentration) may be required for a better
understanding of myeolchi-aekjeot fermentation, which will shed
light on the production of safe and high-quality fish sauces.
Acknowledgments
This work was supported by the Technology Development Program
for Agriculture and Forestry (3120023) of the Ministry for Agriculture,
Food and Rural Affairs and the Cooperative Research Program for
22
S.H. Lee et al. / International Journal of Food Microbiology 203 (2015) 15–22
Agriculture Science & Technology Development (Project No.
PJ00999302), RDA, Republic of Korea.
Appendix A. Supplementary data
Supplementary data to this article can be found online at http://dx.
doi.org/10.1016/j.ijfoodmicro.2015.02.031.
References
AOAC, 2000. Official Methods of Analysis. 17th ed. Association of Official Analytical
Chemists, Washington, D.C., USA.
Brown, S.D., Begemann, M.B., Mormile, M.R., Wall, J.D., Han, C.S., Goodwin, L.A., Pitluck, S.,
Land, M.R., Hauser, L.J., Elias, D.A., 2011. Complete genome sequence of the
haloalkaliphilic, hydrogen-producing bacterium Halanaerobium hydrogeniformans.
J. Bacteriol. 193, 3682–3683.
Chen, Y.S., Yanagida, F., Hsu, J.S., 2006. Isolation and characterization of lactic acid bacteria
from dochi (fermented black beans), a traditional fermented food in Taiwan. Lett.
Appl. Microbiol. 43, 229–235.
Chuon, M.R., Shiomoto, M., Koyanagi, T., Sasaki, T., Michihata, T., Chan, S., Mao, S.,
Enomoto, T., 2014. Microbial and chemical properties of Cambodian traditional
fermented fish products. J. Sci. Food Agric. 94, 1124–1131.
Cole, J.R., Wang, Q., Fish, J.A., Chai, B., McGarrell, D.M., Sun, Y., Brown, C.T., Porras-Alfaro,
A., Kuske, C.R., Tiedje, J.M., 2014. Ribosomal Database Project: data and tools for
high throughput rRNA analysis. Nucleic Acids Res. 42, D633–D642.
Ercolini, D., Ferrocino, I., Nasi, A., Ndagijimana, M., Vernocchi, P., La Storia, A., Laghi, L.,
Mauriello, G., Guerzoni, M.E., Villani, F., 2011. Monitoring of microbial metabolites
and bacterial diversity in beef stored under different packaging conditions. Appl.
Environ. Microbiol. 77, 7372–7381.
Ercolini, D., Pontonio, E., De Filippis, F., Minervini, F., La Storia, A., Gobbetti, M., Di Cagno,
R., 2013. Microbial ecology dynamics during rye and wheat sourdough preparation.
Appl. Environ. Microbiol. 79, 7827–7836.
Fukami, K., Funatsu, Y., Kawasaki, K., Watabe, S., 2004. Improvement of fish sauce odor by
treatment with bacteria isolated from the fish-sauce mush (moromi) made from
rigate mackerel. J. Food Sci. 69, 45–49.
Fukui, Y., Yoshida, M., Shozen, K., Funatsu, Y., Takano, T., Oikawa, H., Yano, Y., Satomi, M.,
2012. Bacterial communities in fish sauce mash using culture-dependent and
-independent methods. J. Gen. Appl. Microbiol. 58, 273–281.
Guan, L., Cho, K.H., Lee, J.H., 2011. Analysis of the cultivable bacterial community in
jeotgal, a Korean salted and fermented seafood, and identification of its dominant
bacteria. Food Microbiol. 28, 101–113.
Halász, A., Baráth, Á., Simon-Sarkadi, L., Holzapfel, W., 1994. Biogenic amines and their
production by microorganisms in food. Trends Food Sci. Technol. 5, 42–49.
Humblot, C., Guyot, J., 2009. Pyrosequencing of tagged 16S rRNA gene amplicons for rapid
deciphering of the microbiomes of fermented foods such as pearl millet slurries. Appl.
Environ. Microbiol. 75, 4354–4361.
Jeong, S.H., Jung, J.Y., Lee, S.H., Jin, H.M., Jeon, C.O., 2013. Microbial succession and metabolite changes during fermentation of dongchimi, traditional Korean watery kimchi.
Int. J. Food Microbiol. 164, 46–53.
Jung, J.Y., Lee, S.H., Lee, H.J., Jeon, C.O., 2013. Microbial succession and metabolite changes
during fermentation of saeu-jeot: traditional Korean salted seafood. Food Microbiol.
34, 360–368.
Jung, J.Y., Lee, S.H., Jeon, C.O., 2014. Microbial community dynamics during fermentation
of doenjang-meju, traditional Korean fermented soybean. Int. J. Food Microbiol. 185,
112–120.
Kim, M.S., Park, E.J., 2014. Bacterial communities of traditional salted and fermented
seafoods from Jeju island of Korea using 16S rRNA gene clone library analysis.
J. Food Sci. 79, M927–M934.
Kobayashi, T., Kimura, B., Fujii, T., 2000. Differentiation of Tetragenococcus populations
occurring in products and manufacturing processes of puffer fish ovaries fermented
with rice-bran. Int. J. Food Microbiol. 56, 211–218.
Kuda, T., Izawa, Y., Ishii, S., Takahashi, H., Torido, Y., Kimura, B., 2012. Suppressive effect of
Tetragenococcus halophilus, isolated from fish-nukazuke, on histamine accumulation
in salted and fermented fish. Food Chem. 130, 569–574.
Lee, H.J., Jung, J.Y., Oh, Y.K., Lee, S.S., Madsen, E.L., Jeon, C.O., 2012. Comparative survey of
rumen microbial communities and metabolites across one caprine and three bovine
groups, using bar-coded pyrosequencing and 1H nuclear magnetic resonance spectroscopy. Appl. Environ. Microbiol. 78, 5983–5993.
Lee, S.H., Jung, J.Y., Jeon, C.O., 2014a. Microbial successions and metabolite changes during
fermentation of salted shrimp (saeu-jeot) with different salt concentrations. PLoS
ONE 9, e90115.
Lee, S.H., Jung, J.Y., Jeon, C.O., 2014b. Effects of temperature on microbial succession and
metabolite change during saeu-jeot fermentation. Food Microbiol. 38, 16–25.
Lopetcharat, K., Choi, Y.J., Park, J.W., Daeschel, M.A., 2001. Fish sauce products and
manufacturing: a review. Food Rev. Int. 17, 65–88.
López, J.R., Navas, J.I., Thanantong, N., de la Herran, R., Sparagano, O.A.E., 2012. Simultaneous identification of five marine fish pathogens belonging to the genera
Tenacibaculum, Vibrio, Photobacterium and Pseudomonas by reverse line blot hybridization. Aquaculture 324–325, 33–38.
MFDS, 2013. Food code. Ministry of Food and Drug Safety. Cheongju, Korea.
Mok, C.K., Lee, J.Y., Song, K.T., Kim, S.Y., Lim, S.B., Woo, G.J., 2000. Changes in physicochemical properties of salted and fermented shrimp at different salt levels. Korean J. Food
Sc. Technol. 32, 187–191.
Nam, E.J., Oh, S.W., Jo, J.H., Kim, Y.M., Yang, C.B., 1998. Purification and characterization of
alkaline protease from saewoo-jeot, salted and fermented shrimp (Acetes japonicus).
Korean J. Food Sci. Technol. 30, 82–89.
Oksanen, J., Blanchet, F.G., Kindt, R., Legendre, P., Minchin, P.R., O'Hara, R.B., Simpson, G.L.,
Solymos, P., Stevens, M.H.H., Wagner, H., 2011. Vegan: community ecology package.
R package version 1.17–12. http://cran.r-project.org/.
Özden, Ö., 2005. Changes in amino acid and fatty acid composition during shelf-life of
marinated fish. J. Sci. Food Agric. 85, 2015–2020.
Roh, S.W., Kim, K.H., Nam, Y.D., Chang, H.W., Park, E.J., Bae, J.W., 2010. Investigation of
archaeal and bacterial diversity in fermented seafood using barcoded pyrosequencing. ISME J. 4, 1–16.
Sakamoto, N., Tanaka, S., Sonomoto, K., Nakayama, J., 2011. 16S rRNA pyrosequencingbased investigation of the bacterial community in nukadoko, a pickling bed of
fermented rice bran. Int. J. Food Microbiol. 144, 352–359.
Taira, W., Funatsu, Y., Satomi, M., Takano, T., Abe, H., 2007. Changes in extractive
components and microbial proliferation during fermentation of fish sauce
from underutilized fish species and quality of final products. Fish. Sci. 73,
913–923.
Tapingkae, W., Tanasupawat, S., Parkin, K.L., Benjakul, S., Visessanguan, W., 2010.
Degradation of histamine by extremely halophilic archaea isolated from high saltfermented fishery products. Enzym. Microb. Technol. 46, 92–99.
Thongsanit, J., Tanasupawat, S., Keeratipibul, S., Jitikavanich, S., 2002. Characterization and
identification of Tetragenococcus halophilus and Tetragenococcus muriaticus strains
from fish sauce (nam-pla). Jpn. J. Lactic Acid Bacteria 13, 46–52.
Udomsil, N., Rodtong, S., Tanasupawat, S., Yongsawatdigul, J., 2010. Proteinase-producing
halophilic lactic acid bacteria isolated from fish sauce fermentation and their ability
to produce volatile compounds. Int. J. Food Microbiol. 141, 186–194.
Udomsil, N., Rodtong, S., Choi, Y.J., Hua, Y., Yongsawatdigul, J., 2011. Use of
Tetragenococcus halophilus as a starter culture for flavor improvement in fish sauce
fermentation. J. Agric. Food Chem. 59, 8401–8408.
Wang, Q., Garrity, G.M., Tiedje, J.M., Cole, J.R., 2007. Na ve Bayesian classifier for rapid
assignment of rRNA sequences into the new bacterial taxonomy. Appl. Environ.
Microbiol. 73, 5261–5267.
Yongsawatdigul, J., Rodtong, S., Raksakulthai, N., 2007. Acceleration of Thai fish sauce
fermentation using proteinases and bacterial starter cultures. J. Food Sci. 72,
M382–M390.