Public Disclosure Authorized
Public Disclosure Authorized
Public Disclosure Authorized
Public Disclosure Authorized
WPS7765
Policy Research Working Paper
7765
Climate Change and Poverty in Vietnam
Background Paper
Exposure to Floods, Climate Change, and Poverty
in Vietnam
Mook Bangalore
Andrew Smith
Ted Veldkamp
Development Economics
Environment and Natural Resources Global Practice Group
&
Climate Change Cross-Cutting Solutions Area
July 2016
Policy Research Working Paper 7765
Abstract
With 70 percent of its population living in coastal areas and
low-lying deltas, Vietnam is exposed to many natural hazards, including river and coastal flooding. These hazards are
expected to worsen due to climate change, and the impacts
of any change in hazard magnitude may be particularly
acute in this region. This paper examines the exposure of
the population and poor people in particular to current and
future flooding at the country level, using new high-resolution flood hazard maps and spatial socioeconomic data. The
paper also examines flood exposure and poverty at the local
level within Ho Chi Minh City. The national-level analysis finds that a third (33 percent) of today’s population is
already exposed to a flood, which occurs once every 25 years,
assuming no protection. For the same return period flood
under current socioeconomic conditions, climate change
may increase the number exposed to 38 to 46 percent of
the population. Climate change impacts can make frequent
events as important as rare ones in terms of exposure: for
instance, the estimates suggest a 25-year flood under future
conditions can expose more people than a 200-year flood
under current conditions. Although poor districts are not
found to be more exposed to floods at the national level, the
city-level analysis of Ho Chi Minh City provides evidence
that slum areas are more exposed than other parts of the
city. The results of this paper show the benefits of investing
today in flood risk management, and can provide guidance
as to where future investments may be targeted. Furthermore, while the main strategy in Vietnam today to manage
flood risk is to reduce exposure, the increase in exposure
estimated in this paper provides support that alternative
strategies to reduce vulnerability (such as financing for
floor-raising) or improve the ability-to-adapt of households
(such as social safety nets) may warrant increased attention.
This paper is a product of the World Bank Environment and Natural Resources Global Practice Group and the Climate
Change Cross-Cutting Solutions Area and is a background paper for the World Bank work on “Climate Change and Poverty
in Vietnam.” It is part of a larger effort by the World Bank to provide open access to its research and make a contribution
to development policy discussions around the world. Policy Research Working Papers are also posted on the Web at http://
econ.worldbank.org. The authors may be contacted at
[email protected].
The Policy Research Working Paper Series disseminates the findings of work in progress to encourage the exchange of ideas about development
issues. An objective of the series is to get the findings out quickly, even if the presentations are less than fully polished. The papers carry the
names of the authors and should be cited accordingly. The findings, interpretations, and conclusions expressed in this paper are entirely those
of the authors. They do not necessarily represent the views of the International Bank for Reconstruction and Development/World Bank and
its affiliated organizations, or those of the Executive Directors of the World Bank or the governments they represent.
Produced by the Research Support Team
Exposure to Floods, Climate Change, and Poverty in Vietnam
Mook Bangalore1, Andrew Smith2, Ted Veldkamp3
1
Climate Policy Team, World Bank, Washington, DC, USA
2
SSBN Ltd, Bristol, UK
3
Institute for Environmental Studies, Vrije Universiteit, Amsterdam
Acknowledgements
This work is part of the programmatic AAA on Vietnam Climate Resilience and Green Growth (P148188)
and was developed under the oversight of Christophe Crepin. It contributed to the global program on
Climate Change and Poverty (P149919) under the oversight of Stephane Hallegatte. The authors thank
Abigail Baca, Christophe Crepin, Chandan Deuskar, Stephane Hallegatte, Stuart Hamilton, Pam McElwee,
Madhu Raghunath, Maurice Rawlins, Ulf Narloch, Dzung Huy Nguyen, and Vo Quc Tuan for valuable
comments and feedback. The authors may be contacted at
[email protected]
JEL codes: Q54, I30, Q50
Keywords: Floods, Poverty, Vietnam, Exposure, Urban Development
1. Introduction
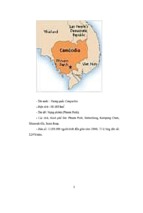
Vietnam is a rapidly developing country highly exposed to natural hazards. One of the major natural risks
the country faces is riverine and coastal flooding, due to its topography and socioeconomic concentration:
Vietnam’s coastline is 3,200 kilometers long and 70 percent of its population lives in coastal areas and
low‐lying deltas (GFDRR 2015). Furthermore, climate change is expected to increase sea levels and the
frequency and intensity of floods, globally and in Southeast Asia (IPCC 2014; World Bank 2014). Given the
country’s concentration of population and economic assets in exposed areas, Vietnam has been ranked
among the five countries most affected by climate change: a 1 meter rise in sea level would partially
inundate 11 percent of the population and 7 percent of agricultural land (World Bank and GFDRR 2011;
GFDRR 2015).
Even though climate change impacts are expected to primarily occur in the future, flooding already causes
major problems in Vietnam, with some segments of the population more vulnerable than others (Adger
1999; World Bank 2010; World Bank and Australian AID 2014). In particular, evidence suggests poor
people are more vulnerable than the rest of the population to natural disasters such as floods, as their
incomes are more dependent on weather, their housing and assets are less protected, and they are more
prone to health impacts (Hallegatte et al. 2016, Chapter 3). Poor people also have a lower capacity to cope
with and adapt to shocks due to lower access to savings, borrowing, or social protection; and climate
change is likely to worsen these trends (Hallegatte et al. 2016, Chapter 5).
Therefore, it is important to quantify how many people are exposed to floods, how this distribution of
exposure falls upon regions and socioeconomic groups, and how climate change may influence these
trends. Employing flood hazard maps and spatial socioeconomic data, this paper examines these
questions in the context of Vietnam:
1. How many people are exposed currently? How might this change under climate change?
2. Where is exposure highest currently? How might this change under climate change?
3. How many poor people are exposed currently? How might this change under climate change?
Furthermore, given that the dynamics of poverty and natural disasters (and particularly, floods) occur at
the local level, analyses at the national scale (or even at the province or district level) may miss important
mechanisms and small‐scale differences, from one city block to the next. To complement the country‐
level analysis, we also focus at the local level within Ho Chi Minh City (HCMC), a city with high flood
exposure. Here, we combine high‐resolution flood hazard data with spatial data on slum location, urban
expansion, and migration, to examine the distribution of exposure across poor and non‐poor locations.
While many studies have examined flood risk in Vietnam, many have only focused on hazard mapping.
The contribution of this paper is to include the socioeconomic dimensions and examine how flood
exposure is distributed across poor and non‐poor locations, at the country and city levels.
The national‐level analysis finds that a third (33%) of today’s population is already exposed to a 25 year
event (an event with a probability of occurrence of 0.04), assuming no protection. For the same return
2
period flood under current socioeconomic conditions, climate change may expose 38‐46% of the
population, depending on the severity of sea level rise. Climate change impacts may make frequent events
as important as rare ones in terms of exposure: for instance, a 25‐year flood under future climate
conditions exposes more people than a 200‐year flood under current conditions. While poor districts are
not found to be more exposed to floods at the national level, the city‐level analysis of HCMC provides
evidence that 68‐85 percent of slum areas are exposed to floods, a higher percentage than the rest of the
city. In addition to showing the benefits of investing today in flood protection, this paper provides policy
implications for the design of flood risk management strategies in Vietnam.
2. Literature review
In the last 30 years, floods worldwide have killed more than 500,000 people and resulted in economic
losses of more than US$500 billion (Kocornik‐Mina et al. 2015). It is therefore no surprise that a number
of studies have examined the population and economic assets exposed to flood risk. At the global level, it
is well documented that an increasing share of the population and economic assets lie in areas exposed
to riverine and coastal flood risk today, and these trends show no sign of slowing down (UN‐ISDR 2015;
Ceola, Laio, and Montanari 2014; Jongman et al. 2014). To compound these socioeconomic changes,
climate change is expected to intensify many hazards and further increase exposure: the number of
people exposed to river floods could increase by 4‐15% in 2030 and 12‐29% in 2080 (Winsemius et al.
2015).
But only a handful of global studies have examined how this distribution of flood exposure differs between
rich and poor. Kim (2012) assesses these dynamics at the country‐level, and finds that poor countries tend
to be more exposed to natural disasters, including floods, compared to rich countries. More recently,
(Winsemius et al. 2015) examined whether poor people within countries are more exposed to flood risk,
and found that this was the case for 60% of the 52 countries sampled.
Within Vietnam, studies suggest that floods significantly impact poverty, both quantitatively at the
national level using household survey data (Bui et al. 2014) and qualitatively through focus group
interviews at the local level in Ho Chi Minh City (World Bank and Australian AID 2014). One study within
Vietnam examines the exposure of poor and non‐poor people to floods and found that a disproportionate
number of poor people live in highly‐flooded areas of the Mekong Delta (Nguyen 2011).
At a more local scale and especially within cities, land and housing markets often push poorer people to
settle in riskier areas. Where markets factor in hazard risks, housing is cheaper where risk is higher (Husby
and Hofkes 2015). And, because poorer people have fewer financial resources to spend on housing and a
generally lower willingness and ability to pay for safety, they are more likely to live in at‐risk areas (Lall
and Deichmann 2012; Fay 2005; Hallegatte et al. 2016).
Empirically, this higher exposure to flood risk for poor urban dwellers is found in about 75% of the
countries examined by (Winsemius et al. 2015), and also when using high‐resolution data on household
location and flood hazards in Mumbai, India (Patankar 2015). This high exposure of the urban poor to
floods has severe implications on the health of children and economic outcomes of adults, as evidenced
in HCMC (World Bank and Australian AID 2014).
3
This paper provides an in‐depth case study of floods, poverty, and climate change in Vietnam and Ho Chi
Minh City, examining the exposure of the total population, and poor people in particular to current and
future flood risk. It makes two contributions; the first is that it combines state‐of‐the‐art hazard maps with
socioeconomic data to examine distributional impacts of floods at the national‐level in Vietnam. Most
previous analyses of floods and climate change in Vietnam at the national‐level have focused on hazard
mapping and not its distributional impacts (Institute of Strategy and Policy on Natural Resources and
Environment 2009; Ministry of Natural Resources and Environment 2009). The second contribution is the
paper’s analysis of flood exposure and poverty at national and local levels: most previous analyses have
focused on one or the other (Winsemius et al. 2015; World Bank and Australian AID 2014).
3. Data
To examine population and poverty‐specific exposure to floods, we employ spatial data defining flood
hazard and a number of socioeconomic characteristics representing poverty and population density.
3.1.
Flood hazard data
3.1.1. Flood hazard maps for Vietnam developed for this study
For this study, we developed flood hazard maps representing riverine, flash‐flood and coastal flood risk
for Vietnam. These flood hazard maps estimate the inundation depth at a grid cell level of 3 arc‐seconds,
(~ 90m) and provide coastal surge hazard layers, along with pluvial and fluvial layers. The maps provide
information on the extent and depth of flood hazard for a specific location. For the coastal component,
we explicitly model four return periods – 25, 50, 100, and 200 year events, under current and future
climate conditions.
There is a significant amount of uncertainty with regards to how much sea level will rise. For that reason
we model three future climate scenarios per return period: a low, medium, and high scenario (Table 1),
using estimates from the IPCC (IPCC 2014; IPCC 2007). For the fluvial and pluvial hazards, future climate
scenarios were not explicitly simulated owing to the complexity and considerable uncertainties that arise
(Smith et al. 2014).1
Although robust modeling of the magnitude of future extreme rainfall is not yet possible, heavy rainfall is
expected to increase in a warmer climate, owing to the increased water holding capacity of the
atmosphere. Therefore instead of a direct modeling approach, future climate scenarios were inferred by
taking flood hazard maps derived under current climate conditions for different return periods, and using
1
These uncertainties largely arise from climate models; global climate models (GCMs) struggle to represent the
physical processes that produce extreme rainfall. Indeed even in higher resolution regional climate models (RCMs),
heavy rainfall events are poorly represented. As a result the modelled rainfall data must be ‘corrected’, in order to
render it realistic. The fact that the underlying models themselves cannot represent flood driving rainfall means
that there is little confidence in the projections that they produce. Moreover, at the national scale there is very
little river gauge data available in Vietnam. Therefore rainfall‐runoff models, required to transform rainfall
projections into river discharge values, would be largely un‐calibrated. This adds an additional source of significant
modeling uncertainty to the model cascade. The combination of poorly represented extreme rainfall in climate
models, coupled with uncalibrated rainfall‐runoff models, would largely render any projections of future flood risk
impractical, owing to the significant uncertainties that arise.
4
them as a proxy for future climate scenarios. The return period hazard maps used for each of the future
scenarios are outlined in Table 2. Although simplistic, this method allows areas that may be impacted by
increasing riverine and extreme rainfall driven flooding to be identified. Clearly there are some significant
assumptions and uncertainties arising from this method. However, given the impracticalities of modeling
future flood risk in Vietnam, this approach provides a plausible and practical attempt to estimate changing
flood risk at the national scale.
For each of the four return periods, four scenarios are modeled (historical, future with low sea level rise,
future with medium sea level rise, and future with high sea level rise), combining the coastal and
fluvial/pluvial hazard layers (Table 2). Importantly, the flood hazard models do not include flood
protection (such as dikes and drainage systems), which can make a large difference in the flood hazard
particularly in well‐protected areas. In these well‐protected areas, our flood maps may over‐estimate the
flood hazard. For full details on the methodology used to produce these hazard maps, see Appendix 1.
Table 1. Future scenarios used for Vietnam coastal modeling. RCP stands for Representative Concentration Pathway. We use two
RCPs from the recent Intergovernmental Panel on Climate Change (IPCC) report (IPCC 2014) to represent a low climate change
and a high climate change scenario. RCP2.6 is a low scenario consistent with temperature increases of 2°C, while RCP8.5 is a high
scenario consistent with temperature increases of 4°C. The A1B scenario was taken from a previous IPCC report (IPCC 2007) and
represents a medium climate change scenario, in between RCP2.6 and RCP8.5.
Simulations
Scenario
Percentile
SLR ‐2100 (m)
Low
Medium
High
RCP 2.6
A1B
RCP 8.5
0.5
0.05
0.95
0.28
0.6
0.98
Table 2. Hazard map scenarios for which the modeling was conducted for Vietnam
Scenario
Coastal
Fluvial/Pluvial
1 in 25
1 in 25 Future – Low
1 in 25 Future – Medium
1 in 25 Future – High
1 in 25
1 in 25 + 28cm
1 in 25 + 6cm
1 in 25 + 98cm
1 in 25
1 in 50
1 in 75
1 in 100
1 in 50
1 in 50 Future – Low
1 in 50 Future – Medium
1 in 50 Future – High
1 in 50
1 in 50 + 28cm
1 in 50 + 6cm
1 in 50 + 98cm
1 in 50
1 in 75
1 in 100
1 in 200
1 in 100
1 in 100 Future – Low
1 in 100 Future – Medium
1 in 100 Future – High
1 in 100
1 in 100 + 28cm
1 in 100 + 6cm
1 in 100 + 98cm
1 in 100
1 in 200
1 in 250
1 in 500
1 in 200
1 in 200 Future – Low
1 in 200 Future – Medium
1 in 200 Future – High
1 in 200
1 in 200 + 28cm
1 in 200 + 6cm
1 in 200 + 98cm
1 in 200
1 in 250
1 in 500
1 in 1000
5
For most of the analyses, the “combined” maps are used, which include both coastal and the fluvial/pluvial
floods. For instance, the combined maps for the 25‐year return period flood (under current conditions,
and low, medium, and high future conditions) are presented in Map 1. A Google Earth image of Ho Chi
Minh City with the flood map for a 25‐year return period with high climate change is presented in Map 2.
Map 1. A visual of what the combined hazard maps (which include coastal and fluvial/pluvial) look like. The map presented here
is the worse‐case scenario we simulate, a 200‐year return period flood with high sea level rise.
Map 2. Google Earth image of the flood maps overlaid with the built environment in Ho Chi Minh City, for the 25‐year return
period under high climate change.
6
3.1.2. Local flood hazard maps for Ho Chi Minh City
In addition to the flood hazard maps developed for this study as described above, we use an additional
set of maps produced specifically for HCMC.
The inundation maps were used in an earlier flood risk study of HCMC (Lasage et al. 2014), and were
composed with the MIKE 11 hydraulic modeling software (DHI 2003). The flood hazard maps, which have
a spatial resolution of 20 meters, represent the current conditions for five return periods: 10, 25, 50, 100,
and 1000 years. Future conditions, again using the five return periods, include a sea level rise scenario of
+30 centimeters in the year 2050 (consistent with the “low” sea level rise used for the maps produced for
this study) in combination with current river discharge (FIM 2013). Potential peaks in precipitation events
and/or river discharges due to climate change are not covered by this data set. The inundation layers for
a 10, 25, and 50‐year return period under current climate conditions and given a sea level rise scenario of
+30 centimeters are shown in Map 3.
Map 3. Flood maps showing inundation depth (cm) in case of a: (a) 10‐year return period flood under current conditions, (b) 25‐
year return period flood under current conditions; (c) 50‐year return period flood under current conditions; (d) 10‐year return
period flood given a 30 cm sea level rise; (e) 25‐year return period flood given a 30 cm sea level rise; and (f) 50‐year return period
flood given a 30 cm sea level rise.
7
3.2.
Socioeconomic data
3.2.1. District‐level poverty and population data
At the national‐level analysis, we overlay the flood hazard maps developed for this study with spatial
socioeconomic data. For Vietnam, the World Bank has produced estimates of the number of people within
each district who live below the poverty line: this “poverty map” is displayed in Map 4a, and the full
methodology can be found in (Lanjouw, Marra, and Nguyen 2013). In addition, we use gridded population
density data with a 1km resolution from Landscan (Geographic Information Science and Technology
2015). This “population map” is displayed in Map 4b.
Map 4. (a) Poverty map and (b) population density map for Vietnam at the district level. Sources: (Lanjouw, Marra, and Nguyen
2013; Geographic Information Science and Technology 2015)
3.2.2. Slum data and urban expansion data in Ho Chi Minh City
The spatial socioeconomic data set used for Ho Chi Minh City is a data set of potential slum areas and of
urban expansion from 2000 to 2010, from the Platform for Urban Management and Analysis (PUMA), a
city‐level data set developed by the World Bank (World Bank 2015).This data was collected via satellite in
the year 2012, through a combination of visual interpretation of various sources and vintages of imagery.
To guide the identification of slums, previous work has provided information on the appearance and
geographical extent of slums in HCMC. Surveys of poverty in the city find the appearance of slums in HCMC
to be characterized as densely built small households and shelters that have predominantly semi‐
permanent character (Habitat for Humanity 2008). In terms of geographic extent, many slums are located
in certain districts ( districts 2, 3, 4, 6, 8, 11, 12, Binh Thanh, Go Vap, Tan Phu) and along the Saigon River
8
(e.g. Kenh Te, Rach Ben Nghe, Thi Nghe‐Nhieu Loc Canal, Kenh Doi, Thi Nghe Canal, Lo Gom, and Canala)
(Horsley 2004; De Lay 2011; Habitat for Humanity 2008). Taking into account these spatial and geographic
characteristics, the PUMA data set interprets Google Earth imagery to produce two layers of potential
slum areas (PUMA 2013): areas with defined borders (polygon‐data) and potential slum areas without
(point‐data) defined borders. In the latter case, we applied a circular buffer of 50 meters around each
point indicating a potential slum location. Evidence suggests that slum areas exist in the northern districts
of HCMC (Habitat for Humanity 2008), which are not reflected in Map 5. For this reason, we ran the
analyses for two samples – all the districts in the province, and only the districts with potential slums from
PUMA.
PUMA also collects data on land‐use change, based on satellite interpretation of land use in 2000 and
2010. The data set identifies areas of urban expansion, defined as “the extension of artificial services and
associated areas”. (PUMA 2013). The slum locations and locations of urban expansion in HCMC are
presented in Map 5.
Map 5. Location of slum areas and locations with urban expansion in the city of HCMC. Source: (PUMA 2013).
4. Methodology
4.1.
Exposure to flooding at the national level
At the national level, we estimate per district the number of people exposed to each scenario of flooding,
and the number of poor people exposed. In the flood data, we define exposed areas as those grid cells
where the flood level is greater than 0; non‐exposed areas are those grid cells where the flood level is
zero. This is a measure of extent rather than depth, and has been used in previous studies to examine
exposure to floods (Jongman et al. 2014; Winsemius et al. 2015; Ceola, Laio, and Montanari 2014).
Furthermore, while we lose information by using extent rather than depth (we have depths in our flood
9
data), we decided to use extent since our flood data assumes no protection. Protection is more likely to
impact the depth, rather than the extent, of the flood results.2
We then overlay this flood layer with the population density data set, to estimate the number of people
per population grid cell that are exposed to floods. As the population density data set is at a lower
resolution (1km) than the flood data (90m), we estimate the percentage of the population grid cell which
is flooded, and multiply this percentage by the population in that grid cell. For instance, if a population
grid cell has 500 people, and 10% of that cell is flooded (based on the flood data), then we estimate 50
people to be exposed to floods in that cell. In doing so, we assume that the population is evenly distributed
within a grid cell.
We run this analysis for all the scenarios presented in Table 2, and aggregate our results at the district
level to estimate the number of people affected. To include the poverty dimension, we use the poverty
headcount rate in each district to estimate the percentage of poor people exposed. For instance, if 20,000
people are exposed to floods in District X, and District X has a poverty headcount rate of 20%, 1,000 poor
people are exposed to floods in that district. In this analysis, we assume that poverty is evenly distributed
within a district.
4.2.
Slum and urban expansion exposure in Ho Chi Minh City
For the HCMC analysis, we estimate the general exposure to flooding, for the whole province of HCMC
and in each of its 24 districts. The flood maps used here are based on a model of HCMC, and are not the
same map as used in the figurative example in Section 4.1.
Exposure to flooding was again evaluated using flood extent (we also evaluate flood depth, for full results,
see Appendix 2). We examine the flood extent in three areas: for all urban areas (the whole HCMC
province), for those areas defined as potential slums (from the PUMA data set), to examine how exposure
to floods is different in slum areas. We do the same for areas defined as urban expansion locations (also
from the PUMA data set) to evaluate whether new urban developments within the province of HCMC take
place in flood prone areas.
Again we use a number of events, from the case of regular flooding (10‐year event) to more extreme
flooding events (1000‐year event). Moreover, we examine how this exposure changes due to climate
change (proxied by sea level rise changes), by running the analysis with flood hazard maps taking into
account a 30 cm sea level rise. In each district and across the whole city, we examine the percentage of
area within each of the three categories (all urban areas, slums, and urban expansion areas) that is
exposed to floods (that is, where flood depth > 0cm) and the percentage which is not exposed to floods
(that is, where flood depth = 0cm). We then compare these values across the three categories.
5. Results
2
There is also a good reason for examining extent over depth, in terms of the hazard modeling; flood depths
within a large scale flood model are very uncertain, and there is much more certainty about extents.
10
5.1.
National‐level analysis for poverty and exposure to floods
5.1.1. Flood risks (with and without climate change)
For the entire country of Vietnam, at the district level, we estimate the total number of people and the
share of the population who are exposed to floods. In the results presented, we examine the four
scenarios for the 25‐year, 50‐year, 100‐year and 200‐year return period flood – a historical scenario, and
three scenarios representing future climate: a low, medium, and high scenarios.
We aggregate the results at the country level.3 A third (33%) of today’s population is already exposed to
a 25‐year flood in Vietnam, assuming no protection (such as dikes and drainage systems), which can make
a large difference in the flood hazard particularly in well‐protected areas. In these well‐protected areas,
our flood maps may over‐estimate the flood hazard.
When including climate change, this percentage increases by 13‐27%, depending on the severity of sea
level rise. This increase in exposure is due to the concentration of the population in coastal areas. For the
50‐year flood, more than a third (38%) of today’s population is already exposed. Given climate change,
this number is expected to increase by 7‐21% (resulting in overall exposure of between 40 and 48%) for
the same return period (50‐year). For a 100‐ and 200‐year flood under a high climate scenario, more than
half of the population is exposed.
Climate change impacts can be seen in these exposure numbers – for instance, a 50‐year flood with
medium climate change impacts has the same exposure of a 200‐year historical flood (at 44%), while
almost half the country’s population (48%) is exposed to a 50‐year flood with high climate impacts. Full
results are presented in Table 3.
Table 3. Population exposed to flood risk in Vietnam, across the 16 flood hazard scenarios examined.
Scenario
Return period
Exposure
Estimated population exposed (m)
Percentage of today’s population
Estimated population exposed (m)
Low climate
Percentage of today’s population
change
Increase due to climate change
Estimated population exposed (m)
Medium
Percentage of today’s population
climate
change
Increase due to climate change
Estimated population exposed (m)
High climate
Percentage of today’s population
change
Increase due to climate change
Historical
25
50
100
200
30.17
33%
34.78
38%
13%
38.03
42%
21%
41.46
46%
27%
34.30
38%
36.87
40%
7%
40.22
44%
15%
43.36
48%
21%
38.35
42%
40.91
45%
6%
43.34
48%
11%
46.13
51%
17%
40.43
44%
42.32
46%
4%
45.16
50%
10%
48.72
53%
17%
3
Results presented are similar to a previous study analyzing the exposure to a 100‐year return period flood
without climate change impacts, which finds 40 million people to be exposed to that event (Jongman et al. 2014).
11
But these national results on exposure are not evenly be distributed across the country. The spatial
analysis also allows us to examine which districts have the highest absolute and the highest relative
exposure. We present results for the 25‐year flood, for a historical and a high climate scenario (results on
geographical extent for other scenarios are similar). For absolute exposure, the largest number of people
exposed are found in the Mekong Delta, the Red River Delta, and the Southeast Coast (Map 6 and Map
7). But the relative exposure (that is, the % of the district population which is exposed to floods) shows a
larger spread. Most areas in the country – including the North Central Coast and the Northeast – have
high percentages of their populations residing in flood‐prone areas (Map 9).
Map 6. Absolute exposure at the district level (total number of people in a district exposed), for a 25‐year historical flood (left) and
a 25‐year historical flood under high climate change (right).
12
Map 7. Total population exposed in the Red River Delta for historical 25‐year flood (left) and 25‐year flood with high climate
impacts (right)
Map 8. Total population exposed in the Mekong for historical 25‐year flood (left) and 25‐year flood with high climate impacts
(right)
13
Map 9. Relative exposure at the district level (% of district population exposed), for a 25‐year historical flood (left) and a 25‐year
flood under high climate change (right).
Map 10. Relative exposure in the Red River Delta for historical 25‐year flood (left) and 25‐year flood with high climate impacts
(right)
14
Map 11. Relative exposure in the Mekong Delta for historical 25‐year flood (left) and 25‐year flood with high climate impacts
(right).
5.1.2. Flood exposure and poverty
Another question is how many poor people are exposed to flood risk in the country. This is important
since case studies of poverty and disasters suggests that poor people are more vulnerable to floods (e.g.
they lose larger portions of their incomes and assets) and they have less access to support to cope and
adapt (Hallegatte et al. 2016).
Livelihood shocks triggered by floods could keep people from escaping poverty and even push them into
deeper poverty (Karim and Noy 2014). Qualitative work undertaken in the provinces of An Giang, Kien
Giang, Kon Tum, Hoa Binh and Bac Ninh confirm that many poor households feel more vulnerable to floods
due to their increased exposure (a result of living in flood prone areas, like along river banks or outside of
protective dikes, and often having substandard quality of housing) and are less likely to have sufficient
assets to buffer the effects of floods (This Report, 2016). Poor households in these provinces also report
receiving inadequate support for coping with the aftermath of floods, and that floods can be one factor
in pushing near‐poor people into poverty if there is not sufficient safety‐net and livelihood support to
flood victims (This Report, 2016).
To examine the question of how many poor people in Vietnam are exposed to flooding, we multiply the
population exposure estimates by the district’s poverty headcount rate (the percentage of people living
below $ USD 1.25 per day), as calculated in (Lanjouw, Marra, and Nguyen 2013).
For a 25‐year historical flood, 30% of today’s poor population is exposed. This number increases by
between 16‐28% given climate change impacts. For a 50‐year return period under a high climate scenario,
40% of today’s poor people in Vietnam are exposed to flooding. For a 200‐year return period under a high
climate scenario, more than half of today’s poor are exposed. Similar to the population analysis, the
15
impact of climate change on the number of poor people exposed is evident. For instance, a 25‐year event
with high climate change impacts has the same exposure as a 200‐year historical event (at around 41% of
poor people being exposed).
Table 4. Number and percentage of poor exposed to flood risk in Vietnam, across the 16 flood hazard scenarios examined.
Scenario
Return period
Exposure
Estimated poor exposed (million)
Percentage of today’s poor
Estimated poor exposed (million)
Low climate
Percentage of today’s poor
change
Increase due to climate change
Estimated poor exposed (million)
Medium
climate
Percentage of today’s poor
change
Increase due to climate change
Estimated poor exposed (million)
High climate
Percentage of today’s poor
change
Increase due to climate change
Historical
25
50
100
200
5.28
30%
6.27
35%
16%
6.80
38%
22%
7.33
41%
28%
6.19
35%
6.64
37%
7%
7.16
40%
14%
7.66
43%
19%
6.88
39%
7.32
41%
6%
7.69
43%
11%
8.14
46%
16%
7.24
41%
7.54
42%
4%
8.00
45%
10%
8.56
48%
15%
Based on the statistics provided in Table 4, there is no strong signal that poor people are more exposed
than non‐poor people, at the national level. However, this may not be the case in specific regions or within
specific districts.
To examine which districts have a confluence of poverty and flood risk, we classify both each district’s
poverty headcount rate and flood exposure into three categories: low, medium, and high. We create 3
quantiles for each. We examine both absolute and relative numbers, overlaying the number of poor and
number of flood exposed, and the percentage of poor and percentage of flood exposed.
The results suggest that areas of the Northern Mountains and the Mekong Delta exhibit districts with high
flood and high poverty (darkest shade of brown in Map 12). The results are slightly different when
comparing relative and absolute numbers. When using absolute (the number of poor and number of flood
exposed) more areas of high flood and poverty are visible in the Mekong and Red River Delta, as well as
along the eastern coasts.
16
A
B
Map 12. Overlay of poverty and flood at the district level for the 25 year‐return period flood with climate change. Map A shows
relative exposure, overlaying the % of poor and % of population flooded, Map B shows the absolute exposure, overlaying the # of
poor and # of population flooded.
Bins: Map A, Poor, Relative (Low = 0‐15%, Med = 15‐28%, High = 28%+)
Bins: Map A, Flood Exposure, Relative (Low = 0‐26%, Med =26‐47% , High =47%+)
Bins: Map B, Poor, Absolute (Low = 0‐15,900, Med =15,900 – 31,000, High = 31,000+)
Bins: Map B, Flood Exposure, Absolute (Low = 0‐27,000, Med =27,000 – 70,000, High = 70,000+)
However, even though not all of the poorest districts do not seem to face higher exposure risk to floods,
it is important to remember that poor households and poor individuals within high exposure areas have
generally higher vulnerability to the impact of floods. Further, it is very likely that within a district or city,
the poorest are the most exposed to floods. We explore this dynamic at the local scale with a city‐level
analysis of Ho Chi Minh City.
5.2.
City‐level analysis in HCMC for poverty and exposure to floods
While the relationship between poverty and exposure to floods may not be evident at the national or
district level, at a more local scale and especially in urban areas, land and housing markets often push
poorer people to settle in riskier areas (Lall and Deichmann 2012). For instance, comparing exposure of
poor people to average exposure, poor households are 71% more exposed to flooding in the Mithi River
Basin in Mumbai, India (Hallegatte et al. 2016).
17
We examine these dynamics in Ho Chi Minh City, using high‐resolution local‐scale flood maps designed
specifically for HCMC (Lasage et al. 2014) and proxy for poverty using the spatial location of potential
slums from the Platform for Urban Management and Analysis (PUMA) data set (World Bank 2015). The
PUMA data set also has information on locations of urban expansion from 2000 to 2012. We therefore
examine exposure to flooding in all three locations – urban areas as a whole, potential slum locations, and
areas of urban expansion. The results we present below are for all districts in HCMC; results for only
districts with slum areas are similar and thus not reported.
We find that a relatively high percentage of the potential slum areas are exposed to floods, ranging from
68.9% (for a 10‐year return period) up to 83.3% (for a 1000‐year return period). When considering all
urban areas of HCMC, exposure to flooding is lower: 63% (for a 10‐year return period) up to 68.3% (for a
1000‐year return period). A sea level rise of 30 cm increases the extent of flooded areas the most in slum
areas and for a low‐probability but recurrent flood (10‐year flood). For a 10‐year flood and looking only
within slum areas, we find an increase in exposure of 15 percentage‐points due to sea level rise, compared
to a difference of 5.7 percentage‐points when looking at the entire urban area of HCMC. These results, as
presented in Figure 1, suggest slum areas to be more exposed to floods than non‐slum areas.4
Due to cognitive biases, it can be hypothesized that flood risk from frequent events (like the 10‐year return
period event) are more likely to be remembered than a rare event (like the 1000‐year return period event)
and thus more likely to be included in land values. If this logic holds, it is likely that potential slum areas
should exhibit a higher exposure than other areas for frequent events. However, in our analysis we find
the opposite: that the difference between slum and non‐slum increases as the return period event gets
rarer.
When looking at the areas of urban expansion we find that a large share, 72.2% under a flooding event
with a 10‐year year return period up to 74.4% in case of a 1000‐year return period, of these areas is
located in areas prone to flooding (Figure 1).
4
Disaggregated results per district can be found in Appendix 2. Results using depth as an indicator for flooding is
also presented in Appendix 2.
18