Public Disclosure Authorized
Public Disclosure Authorized
12
Public Disclosure Authorized
Public Disclosure Authorized
68172
WORLD
DEVELOPMENT
INDICATORS
Low income
Afghanistan
Bangladesh
Benin
Burkina Faso
Burundi
Cambodia
Central African Republic
Chad
Comoros
Congo, Dem. Rep.
Eritrea
Ethiopia
Gambia, The
Guinea
Guinea-Bissau
Haiti
Kenya
Korea, Dem. Rep.
Kyrgyz Republic
Liberia
Madagascar
Malawi
Mali
Mozambique
Myanmar
Nepal
Niger
Rwanda
Sierra Leone
Somalia
Tajikistan
Tanzania
Togo
Uganda
Zimbabwe
Lower middle income
Angola
Armenia
Belize
Bhutan
Bolivia
Cameroon
Cape Verde
Congo, Rep.
Côte d'Ivoire
Djibouti
Egypt, Arab Rep.
El Salvador
Fiji
Georgia
Ghana
Guatemala
Guyana
Honduras
India
Indonesia
Iraq
Kiribati
Kosovo
Lao PDR
Lesotho
Marshall Islands
Mauritania
Micronesia, Fed. Sts.
Moldova
Mongolia
Morocco
Nicaragua
Nigeria
Pakistan
Papua New Guinea
Paraguay
Philippines
Samoa
São Tomé and Príncipe
Senegal
Solomon Islands
Sri Lanka
South Sudan
Sudan
Swaziland
Syrian Arab Republic
Timor-Leste
Tonga
Turkmenistan
Tuvalu
Ukraine
Uzbekistan
Vanuatu
Vietnam
West Bank and Gaza
Yemen, Rep.
Zambia
Upper middle income
Albania
Algeria
American Samoa
Antigua and Barbuda
Argentina
Azerbaijan
Belarus
Bosnia and Herzegovina
Botswana
Brazil
Bulgaria
Chile
China
Colombia
Costa Rica
Cuba
Dominica
Dominican Republic
Ecuador
Gabon
Grenada
Iran, Islamic Rep.
Jamaica
Jordan
Kazakhstan
Latvia
Lebanon
Libya
Lithuania
Macedonia, FYR
Malaysia
Maldives
Mauritius
Mayotte
Mexico
Montenegro
Namibia
Palau
Panama
Peru
Romania
Russian Federation
Serbia
Seychelles
South Africa
St. Kitts and Nevis
St. Lucia
St. Vincent & Grenadines
Suriname
Thailand
Tunisia
Turkey
Uruguay
Venezuela, RB
High income
Andorra
Aruba
Australia
Austria
Bahamas, The
Bahrain
Barbados
Belgium
Bermuda
Brunei Darussalam
Canada
Cayman Islands
Channel Islands
Croatia
Curaçao
Cyprus
Czech Republic
Denmark
Equatorial Guinea
Estonia
Faeroe Islands
Finland
France
French Polynesia
Germany
Gibraltar
Greece
Greenland
Guam
Hong Kong SAR, China
Hungary
Iceland
Ireland
Isle of Man
Israel
Italy
Japan
Korea, Rep.
Kuwait
Liechtenstein
Luxembourg
Macao SAR, China
Malta
Monaco
Netherlands
New Caledonia
New Zealand
Northern Mariana Islands
Norway
Oman
Poland
Portugal
Puerto Rico
Qatar
San Marino
Saudi Arabia
Singapore
Sint Maarten
Slovak Republic
Slovenia
Spain
St. Martin
Sweden
Switzerland
Trinidad and Tobago
Turks and Caicos Islands
United Arab Emirates
United Kingdom
United States
Virgin Islands (U.S.)
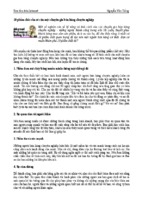
INCOME MAP
The world by income
The world by income
Low ($1,005 or less)
Classified according to
World Bank estimates of
2010 GNI per capita
Lower middle ($1,006–$3,975)
Upper middle ($3,976–$12,275)
High ($12,276 or more)
No data
Greenland
(Den)
Iceland
Norway
Faeroe
Islands
(Den)
Sweden
Finland
Russian Federation
The Netherlands
Estonia
Denmark Russian Latvia
Fed.
Lithuania
United
Belarus
Germany Poland
Kingdom
Belgium
Ukraine
Moldova
Romania
France Italy
Isle of Man (UK)
Canada
Ireland
Channel Islands (UK)
Luxembourg
Liechtenstein
Switzerland
Andorra
United States
Kazakhstan
Bulgaria
Portugal
Spain
Monaco
Turkey
Greece
Gibraltar (UK)
Bermuda
(UK)
Tunisia
Cyprus
Lebanon
Israel
Syrian
Arab
Rep.
West Bank and Gaza
Jordan
Malta
Morocco
Georgia
Armenia
Azerbaijan
Cayman Is.(UK)
Libya
Former
Spanish
Sahara
Saudi
Arabia
Cuba
Belize Jamaica
Guatemala Honduras
El Salvador Nicaragua
Costa Rica
Mauritania
Haiti
Cape Verde
Mali
Senegal
The Gambia
Guinea-Bissau
Guinea
Panama
R.B. de
Venezuela
Guyana
Suriname
Sierra Leone
Liberia
French Guiana (Fr)
Colombia
Niger
Benin
Côte Ghana
d’Ivoire
Cameroon
Congo
Malawi
Zimbabwe
Tonga
Namibia
Paraguay
Germany
Antigua and Barbuda
U.S. Virgin
Islands (US)
St. Kitts
and Nevis
Curaçao (Neth)
Argentina
Dominica
St. Lucia
St. Vincent and
the Grenadines
Barbados
Grenada
Trinidad
and Tobago
Guam (US)
Philippines
Federated States of Micronesia
Brunei Darussalam
Malaysia
Marshall Islands
Palau
Nauru
Singapore
Botswana
South
Africa
Poland
Kiribati
Comoros
Solomon
Islands
Papua New Guinea
Indonesia
Tuvalu
Mayotte
(Fr)
Madagascar
Vanuatu
Fiji
Mauritius
Réunion (Fr)
Australia
New
Caledonia
(Fr)
Lesotho
Czech Republic
Ukraine
Slovak Republic
Austria
Guadeloupe (Fr)
Martinique (Fr)
Aruba (Neth)
Chile
Uruguay
N. Mariana Islands (US)
Seychelles
Mozambique
Swaziland
St. Maarten (Neth)
Lao
P.D.R.
Maldives
Kenya
Rwanda
Dem.Rep.of
Burundi
Congo
Tanzania
Zambia
St. Martin (Fr)
Myanmar
Sri
Lanka
Somalia
Uganda
Gabon
Bolivia
Puerto
Rico (US)
India
Vietnam
Cambodia
South
Sudan
Angola
American
Samoa (US)
Bangladesh
Thailand
Brazil
Peru
Bhutan
Nepal
Rep. of Yemen
Ethiopia
Central
African
Republic
Japan
Timor-Leste
French Polynesia (Fr)
Dominican
Republic
Pakistan
Djibouti
Nigeria
Kiribati
Samoa
Eritrea
Sudan
Burkina
Faso
Togo
Equatorial Guinea
São Tomé and Príncipe
Ecuador
Chad
Rep.of
Korea
China
Afghanistan
United Arab
Emirates
Oman
Turks and Caicos Is. (UK)
Mexico
Fiji
Arab Rep.
of Egypt
Dem.People’s
Rep.of Korea
Tajikistan
Bahrain
Qatar
Algeria
The Bahamas
Turkmenistan
Islamic Rep.
of Iran
Kuwait
Iraq
Mongolia
Kyrgyz
Rep.
Uzbekistan
Romania
Bosnia and
Herzegovina
San
Marino
Italy Montenegro
Vatican
City
New
Zealand
Hungary
Slovenia
Croatia
Serbia
Kosovo Bulgaria
FYR
Macedonia
Albania
Greece
R.B. de Venezuela
Antarctica
IBRD 39125 MARCH 2012
Designed, edited, and produced by
Communications Development Incorporated,
Washington, D.C.,
with Peter Grundy Art & Design, London
2012
WORLD DEVELOPMENT
INDICATORS
Copyright 2012 by the International Bank
for Reconstruction and Development/THE WORLD BANK
1818 H Street NW, Washington, D.C. 20433 USA
All rights reserved
Manufactured in the United States of America
First printing April 2012
This volume is a product of the staff of the Development Data Group of the World Bank’s Development Economics
Vice Presidency, and the judgments herein do not necessarily reflect the views of the World Bank’s Board of Executive Directors or the countries they represent.
The World Bank does not guarantee the accuracy of the data included in this publication and accepts no responsibility whatsoever for any consequence of their use. The boundaries, colors, denominations, and other information
shown on any map in this volume do not imply on the part of the World Bank any judgment on the legal status of
any territory or the endorsement or acceptance of such boundaries. This publication uses the Robinson projection
for maps, which represents both area and shape reasonably well for most of the earth’s surface. Nevertheless,
some distortions of area, shape, distance, and direction remain.
The material in this publication is copyrighted. Requests for permission to reproduce portions of it should be sent
to the Office of the Publisher at the address in the copyright notice above. The World Bank encourages dissemination of its work and will normally give permission promptly and, when reproduction is for noncommercial purposes,
without asking a fee. Permission to photocopy portions for classroom use is granted through the Copyright Center,
Inc., Suite 910, 222 Rosewood Drive, Danvers, MA 01923 USA.
Photo credits: World Bank photo library, except page 282, David Cieslikowski/World Bank.
If you have questions or comments about this product, please contact:
Development Data Group
The World Bank
1818 H Street NW, Room MC2-812, Washington, D.C. 20433 USA
Hotline: 800 590 1906 or 202 473 7824; fax 202 522 1498
Email:
[email protected]
Web site: www.worldbank.org or data.worldbank.org
ISBN 978-0-8213-8985-0
ECO -AUDIT
Environmental Benefits Statement
The World Bank is committed to preserving endangered forests and natural resources. The Office of the Publisher
has chosen to print World Development Indicators 2012 on recycled paper with 50 percent postconsumer fiber in
accordance with the recommended standards for paper usage set by the Green Press Initiative, a nonprofit program
supporting publishers in using fiber that is not sourced from endangered forests. For more information, visit www.
greenpressinitiative.org.
Saved:
64 trees
26 million Btu of total energy
6,503 pounds of net greenhouse gases
29,321 gallons of waste water
1,859 pounds of solid waste
2012
WORLD DEVELOPMENT
INDICATORS
PREFACE
World Development Indicators 2012 is a compilation of relevant, high-quality, and internationally comparable statistics
about development and the quality of people’s lives. Organized around six themes—world view, people, the environment,
the economy, states and markets, and global links—it aims to put data into the hands of policy makers, development
specialists, students, and the public. We encourage and applaud the use of the data presented here to help reduce
poverty and to solve the world’s most pressing development challenges.
The full dataset used to produce World Development Indicators contains more than 1,000 indicators for 216 economies, with many time series extending back to 1960. Highly visual, interactive, and multilingual presentations of the
data are available at the popular website http://data.worldbank.org and through the DataFinder application for mobile
devices. And, as a major part of the World Bank’s Open Data Initiative, the data are freely available for use and reuse
under an open license. A companion printed volume, The Little Data Book 2012, presents a selection of indicators
for each economy, and the biennial Statistics for Small States presents data for less-populated developing countries.
This 16th edition of World Development Indicators relies heavily on statistics produced by national authorities and
agencies. Since the first edition in 1997, there has been a substantial increase in the availability and quality of the
data, thanks to improvements in statistical capacity in many countries. More remains to be done: the capacity to use
statistical data remains weak; demand is growing for greater disaggregation of indicators (for instance by sex, age, or
geography); and data in some key areas, such as agriculture, are often missing or outdated. A new global statistical
action plan (www.paris21.org/busan-action-plan), endorsed in November 2011 at the highest political levels at the
Fourth High Level Forum on Aid Effectiveness in Busan, Republic of Korea, provides an important framework to address
remaining challenges, to integrate statistics into decision making, to promote open access to data and improve their
use, and to increase resources for statistical systems.
World Development Indicators is possible only through the excellent collaboration of many partners who provide the
data for this collection, and I would like to thank them all: the United Nations family, the International Monetary Fund,
the International Telecommunication Union, the Organisation for Economic Co-operation and Development, the statistical offices of more than 200 economies, and countless others whose support and advice have made this unique
product possible.
As always, we welcome your ideas for making the data in World Development Indicators useful and relevant for improving the lives of people around the world.
Shaida Badiee
Director
Development Economics Data Group
2012 World Development Indicators
v
ACKNOWLEDGMENTS
This book was prepared by a team led by Soong Sup Lee under the management of Neil Fantom and comprising
Awatif Abuzeid, Azita Amjadi, Maja Bresslauer, David Cieslikowski, Liu Cui, Mahyar Eshragh-Tabary, Shota Hatakeyama,
Masako Hiraga, Wendy Ven-dee Huang, Bala Bhaskar Naidu Kalimili, Buyant Khaltarkhuu, Elysee Kiti, Alison Kwong,
Ibrahim Levent, Hiroko Maeda, Johan Mistiaen, Maurice Nsabimana, Sulekha Patel, Beatriz Prieto-Oramas,
William Prince, Premi Rathan Raj, Evis Rucaj, Emi Suzuki, Eric Swanson, Jomo Tariku, and Estela Zamora, working
closely with other teams in the Development Economics Vice Presidency’s Development Data Group. World Development Indicators electronic products were prepared by a team led by Reza Farivari and comprising Ramvel Chandrasekaran, Ying Chi, Jean-Pierre Djomalieu, Ramgopal Erabelly, Federico Escaler, Shelley Fu, Gytis Kanchas, Ugendran
Makhachkala, Vilas Mandlekar, Nacer Megherbi, Shanmugam Natarajan, Parastoo Oloumi, Atsushi Shimo, Maryna
Taran, Malarvizhi Veerappan, and Vera Wen. The work was carried out under the direction of Shaida Badiee. Valuable
advice was provided by Zia M. Qureshi and David Rosenblatt.
The choice of indicators and text content was shaped through close consultation with and substantial contributions from
staff in the World Bank’s four thematic networks—Financial and Private Sector Development, Human Development,
Poverty Reduction and Economic Management, and Sustainable Development—and staff of the International Finance
Corporation and the Multilateral Investment Guarantee Agency. Most important, the team received substantial help,
guidance, and data from external partners. For individual acknowledgments of contributions to the book’s content,
please see Credits. For a listing of our key partners, see Partners.
Communications Development Incorporated provided overall design direction, editing, and layout, led by
Meta de Coquereaumont, Bruce Ross-Larson, and Christopher Trott and assisted by Rob Elson. Elaine Wilson created
the cover and graphics and typeset the book. Joseph Caponio provided production assistance. Peter Grundy, of
Peter Grundy Art & Design, designed the report. Staff from External Affairs oversaw printing and dissemination of the
book.
2012 World Development Indicators
vii
TABLE OF CONTENTS
FRONT
Preface
Acknowledgments
Partners
Users guide
v
vii
xii
xxii
1. WORLD VIEW
Introduction
1.4
1.5
1.6
Tables
Size of the economy
Millennium Development Goals: eradicating poverty and saving
lives
Millennium Development Goals: protecting our common
environment
Millennium Development Goals: overcoming obstacles
Women in development
Key indicators for other economies
1a
1b
1c
1d
1e
1f
1g
1h
1i
1j
1k
1l
1m
1n
1o
1p
1q
1r
1s
Text figures, tables, and boxes
Poverty rates fell sharply in the new millennium
Fewer people living in extreme poverty
Progress toward poverty reduction
Progress toward reducing undernourishment
More and less income equality
Many children remain malnourished
The last step toward education for all
64 million children out of school
Progress toward education for all
The missing enrollments
How much schooling
Increasing participation by girls at all levels of education
Progress toward gender equality in education
Women have become a larger part of the workforce
More women decisionmakers
A slim lead for girls
Still far to go in reducing under-five mortality
Most deaths occur in the first year of life
Progress toward reducing child mortality
1.1
1.2
1.3
viii
2012 World Development Indicators
1
20
24
28
32
34
38
2
2
3
3
3
3
4
4
5
5
5
6
7
7
7
7
8
8
9
1t
1u
1v
1w
1x
1y
1z
1aa
1bb
1cc
1dd
1ee
1ff
1gg
1hh
1ii
1jj
1kk
1ll
1mm
1nn
1oo
1pp
1qq
1rr
1.2a
1.3a
1.4a
Preventing childhood diseases
For some, better than expected improvements
Maternal mortality rates have been falling but large regional
differences persist
The 12 countries with highest lifetime risk of maternal death
Progress in reducing maternal mortality
Planning for motherhood
Fewer young women giving birth
Help for mothers
Bringing HIV/AIDS under control
Millions of people still afflicted with HIV/AIDS
Progress toward reversing the HIV epidemic
Turning the tide of tuberculosis
Protecting children from malaria
Carbon dioxide emissions continue to rise
Forest losses and gains
Progress toward improved sanitation
Progress toward improved water sources
Many still lack access to sanitation
Water demand strains supplies
Most donors have maintained their aid levels
But their domestic subsidies to agricultural are greater
Developing countries have easier access to Organisation
for Economic Co-operation and Development markets
Cellular phones are connecting developing countries
Debt service burdens have been falling
A more connected world
Location of indicators for Millennium Development Goals 1–4
Location of indicators for Millennium Development Goals 5–7
Location of indicators for Millennium Development Goal 8
9
9
10
10
11
11
11
11
12
12
13
13
13
14
14
15
15
15
15
16
16
17
17
17
17
27
31
33
2. PEOPLE
Introduction
2.1
2.2
2.3
2.4
2.5
2.6
2.7
2.8
2.9
2.10
2.11
2.12
2.13
2.14
2.15
2.16
2.17
2.18
2.19
2.20
2.21
2.22
2.23
2.24
2.8a
2.8b
2.8c
Tables
Population dynamics
Labor force structure
Employment by economic activity
Decent work and productive employment
Unemployment
Children at work
Poverty rates at national poverty lines
Poverty rates at international poverty lines
Distribution of income or consumption
Assessing vulnerability and security
Education inputs
Participation in education
Education efficiency
Education completion and outcomes
Education gaps by income and gender
Health systems
Health information
Disease prevention coverage and quality
Reproductive health
Nutrition and growth
Nutrition intake and supplements
Health risk factors and future challenges
Mortality
Health gaps by income
Text figures, tables, and boxes
While the number of people living on less than $1.25 a day
has fallen, the number living on $1.25–$2 a day has increased
Poverty rates are falling in all developing regions
Regional poverty estimates
3. ENVIRONMENT
41
42
46
50
54
58
62
66
72
74
78
82
86
90
94
98
100
104
108
112
116
120
124
128
132
Introduction
137
3.10
3.11
3.12
3.13
3.14
3.15
3.16
3.17
3.18
Tables
Rural population and land use
Agricultural inputs
Agricultural output and productivity
Deforestation and biodiversity
Freshwater
Water pollution
Energy production and use
Electricity production, sources, and access
Energy dependency and efficiency and carbon dioxide
emissions
Trends in greenhouse gas emissions
Carbon dioxide emissions by sector
Climate variability, exposure to impact, and resilience
Urbanization
Urban housing conditions
Traffic and congestion
Air pollution
Government commitment
Contribution of natural resources to gross domestic product
170
174
178
182
186
190
194
198
200
204
3.1a
Text figures, tables, and boxes
What is rural? Urban?
141
3.1
3.2
3.3
3.4
3.5
3.6
3.7
3.8
3.9
138
142
146
150
154
158
162
166
71
71
72
2012 World Development Indicators
ix
TABLE OF CONTENTS
4. ECONOMY
4.a
4.1
4.2
4.3
4.4
4.5
4.6
4.7
4.8
4.9
4.10
4.11
4.12
4.13
4.14
4.15
4.16
4.17
x
5. STATES AND MARKETS
Introduction
209
Tables
Recent economic performance
Growth of output
Structure of output
Structure of manufacturing
Structure of merchandise exports
Structure of merchandise imports
Structure of service exports
Structure of service imports
Structure of demand
Growth of consumption and investment
Toward a broader measure of national income
Toward a broader measure of savings
Central government finances
Central government expenses
Central government revenues
Monetary indicators
Exchange rates and prices
Balance of payments current account
210
214
218
222
226
230
234
238
242
246
250
254
258
262
266
270
274
278
2012 World Development Indicators
5.1
5.2
5.3
5.4
5.5
5.6
5.7
5.8
5.9
5.10
5.11
5.12
5.13
Introduction
283
Tables
Private sector in the economy
Business environment: enterprise surveys
Business environment: Doing Business indicators
Stock markets
Financial access, stability, and efficiency
Tax policies
Military expenditures and arms transfers
Fragile situations
Public policies and institutions
Transport services
Power and communications
The information society
Science and technology
284
288
292
296
300
304
308
312
316
320
324
328
332
6. GLOBAL LINKS
Introduction
6.1
6.2
6.3
6.4
6.5
6.6
6.7
6.8
6.9
6.10
6.11
6.12
6.13
6.14
6.15
6.6a
6.13a
Tables
Growth of merchandise trade
Direction and growth of merchandise trade
High-income economy trade with
low- and middle-income economies
Direction of trade of developing economies
Primary commodity prices
Regional trade blocs
Tariff barriers
Trade facilitation
External debt
Global private financial flows
Net official financial flows
Aid dependency
Distribution of net aid by Development Assistance Committee
members
Movement of people across borders
Travel and tourism
Text figures, tables, and boxes
Global Preferential Trade Agreement Database
Official development assistance from non-DAC donors,
2006–10
BACK
337
338
342
Primary data documentation
Statistical methods
Credits
Bibliography
Index of indicators
391
402
404
406
414
344
346
349
352
354
358
362
366
370
374
378
382
386
353
381
2012 World Development Indicators
xi
PARTNERS
Defining, gathering, and disseminating international statistics is a collective effort of many people and
organizations. The indicators presented in World Development Indicators are the fruit of decades of work
at many levels, from the field workers who administer censuses and household surveys to the committees
and working parties of the national and international statistical agencies that develop the nomenclature,
classifications, and standards fundamental to an international statistical system. Nongovernmental organizations and the private sector have also made important contributions, both in gathering primary data and in
organizing and publishing their results. And academic researchers have played a crucial role in developing
statistical methods and carrying on a continuing dialogue about the quality and interpretation of statistical
indicators. All these contributors have a strong belief that available, accurate data will improve the quality
of public and private decisionmaking.
The organizations listed here have made World Development Indicators possible by sharing their data
and their expertise with us. More important, their collaboration contributes to the World Bank’s efforts,
and to those of many others, to improve the quality of life of the world’s people. We acknowledge our debt
and gratitude to all who have helped to build a base of comprehensive, quantitative information about the
world and its people.
For easy reference, Web addresses are included for each listed organization. The addresses shown were
active on March 1, 2012. Information about the World Bank is also provided.
International and government agencies
Carbon Dioxide Information Analysis Center
The Carbon Dioxide Information Analysis Center (CDIAC) is the primary global climate change data and information analysis center of the U.S. Department of Energy. The CDIAC’s scope includes anything that would
potentially be of value to those concerned with the greenhouse effect and global climate change, including
concentrations of carbon dioxide and other radiatively active gases in the atmosphere, the role of the terrestrial biosphere and the oceans in the biogeochemical cycles of greenhouse gases, emissions of carbon
dioxide to the atmosphere, long-term climate trends, the effects of elevated carbon dioxide on vegetation,
and the vulnerability of coastal areas to rising sea levels.
For more information, see http://cdiac.ornl.gov.
Centre for Research on the Epidemiology of Disasters
Since 1988 the World Health Organization Collaborating Centre for Research on the Epidemiology of Disasters has maintained the Emergency Events Database, which was created with support from the Belgian
government. The main objective of the database is to serve the purposes of humanitarian action at the
national and international levels. It aims to rationalize decisionmaking for disaster preparedness and provide
an objective base for vulnerability assessment and priority setting. The database contains essential core
data—compiled from various sources, including UN agencies, nongovernmental organizations, insurance
companies, research institutes, and press agencies—on the occurrence and effects of more than 18,000
mass disasters since 1900.
For more information, see www.emdat.be.
xii
2012 World Development Indicators
Deutsche Gesellschaft für Internationale Zusammenarbeit
The Deutsche Gesellschaft für Internationale Zusammenarbeit (GIZ) GmbH is a German government-owned
corporation for international cooperation with worldwide operations. GIZ’s aim is to positively shape political, economic, ecological, and social development in partner countries, thereby improving people’s living
conditions and prospects.
For more information, see www.giz.de.
Food and Agriculture Organization
The Food and Agriculture Organization, a specialized agency of the United Nations, was founded in October
1945 with a mandate to raise nutrition levels and living standards, to increase agricultural productivity,
and to better the condition of rural populations. The organization provides direct development assistance;
collects, analyzes, and disseminates information; offers policy and planning advice to governments; and
serves as an international forum for debate on food and agricultural issues.
For more information, see www.fao.org.
Internal Displacement Monitoring Centre
The Internal Displacement Monitoring Centre was established in 1998 by the Norwegian Refugee Council and
is the leading international body monitoring conflict-induced internal displacement worldwide. The center contributes to improving national and international capacities to protect and assist the millions of people around
the globe who have been displaced within their own country as a result of conflicts or human rights violations.
For more information, see www.internal-displacement.org.
International Civil Aviation Organization
The International Civil Aviation Organization (ICAO), a specialized agency of the United Nations, is responsible for establishing international standards and recommended practices and procedures for the technical,
economic, and legal aspects of international civil aviation operations. ICAO’s strategic objectives include
enhancing global aviation safety and security and the efficiency of aviation operations, minimizing the
adverse effect of global civil aviation on the environment, maintaining the continuity of aviation operations,
and strengthening laws governing international civil aviation.
For more information, see www.icao.int.
International Energy Agency
Founded in 1974, the International Energy Agency’s (IEA) mandate is to facilitate cooperation among member
countries in order to increase energy efficiency, promote use of clean energy and technology, and diversify
energy sources while protecting the environment. The IEA publishes annual and quarterly statistical publications covering both Organisation for Economic Co-operation and Development (OECD) and non-OECD
countries’ data on oil, gas, coal, electricity, and renewable sources of energy; energy supply and consumption; and energy prices and taxes. The IEA also analyzes all aspects of sustainable development globally
and provides policy recommendations.
For more information, see www.iea.org.
2012 World Development Indicators
xiii
PARTNERS
International Labour Organization
The International Labour Organization (ILO), a specialized agency of the United Nations, seeks the promotion
of social justice and internationally recognized human and labor rights. ILO helps advance the creation of
decent jobs and the kinds of economic and working conditions that give working people and business people
a stake in lasting peace, prosperity, and progress. As part of its mandate, the ILO maintains an extensive
statistical publication program.
For more information, see www.ilo.org.
International Monetary Fund
The International Monetary Fund (IMF) is an international organization of 187 member countries established
to promote international monetary cooperation, a stable system of exchange rates, and the balanced expansion of international trade and to foster economic growth and high levels of employment. The IMF reviews
national, regional, and global economic and financial developments; provides policy advice to member
countries; and serves as a forum where they can discuss the national, regional, and global consequences
of their policies.
The IMF also makes financing temporarily available to member countries to help them address balance
of payments problems. Among the IMF’s core missions are the collection and dissemination of high-quality
macroeconomic and financial statistics as an essential prerequisite for formulating appropriate policies. The
IMF provides technical assistance and training to member countries in areas of its core expertise, including
the development of economic and financial data in accordance with international standards.
For more information, see www.imf.org.
International Telecommunication Union
The International Telecommunication Union (ITU) is the leading UN agency for information and communication technologies. ITU’s mission is to enable the growth and sustained development of telecommunications
and information networks and to facilitate universal access so that people everywhere can participate in,
and benefit from, the emerging information society and global economy. A key priority lies in bridging the
so-called Digital Divide by building information and communication infrastructure, promoting adequate
capacity building, and developing confidence in the use of cyberspace through enhanced online security.
ITU also concentrates on strengthening emergency communications for disaster prevention and mitigation.
For more information, see www.itu.int.
National Science Foundation
The National Science Foundation (NSF) is an independent U.S. government agency whose mission is to
promote the progress of science; to advance the national health, prosperity, and welfare; and to secure the
national defense. NSF’s goals—discovery, learning, research infrastructure, and stewardship—provide an
integrated strategy to advance the frontiers of knowledge, cultivate a world-class, broadly inclusive science
and engineering workforce, expand the scientific literacy of all citizens, build the nation’s research capability through investments in advanced instrumentation and facilities, and support excellence in science and
engineering research and education through a capable and responsive organization.
For more information, see www.nsf.gov.
xiv
2012 World Development Indicators
The Office of U.S. Foreign Disaster Assistance
On November 3, 1961, U.S. President John F. Kennedy established the U.S. Agency for International Development (USAID), the first U.S. foreign assistance organization whose primary emphasis was long-range economic
and social development assistance to foreign countries. The Office of U.S. Foreign Disaster Assistance is the
office within USAID responsible for providing nonfood humanitarian assistance in response to international
crises and disasters. The USAID administrator is designated as the president’s special coordinator for international disaster assistance, which the Office of U.S. Foreign Disaster Assistance assists in coordinating.
For more information see www.globalcorps.com/ofda.html and www.usaid.gov/our_work/humanitarian_
assistance/disaster_assistance.
Organisation for Economic Co-operation and Development
The Organisation for Economic Co-operation and Development (OECD) includes 34 member countries sharing a commitment to democratic government and the market economy to support sustainable economic
growth, boost employment, raise living standards, maintain financial stability, assist other countries’ economic development, and contribute to growth in world trade. With active relationships with some 100 other
countries, it has a global reach. It is best known for its publications and statistics, which cover economic
and social issues from macroeconomics to trade, education, development, and science and innovation.
The Development Assistance Committee (DAC, www.oecd.org/dac) is one of the principal bodies through
which the OECD deals with issues related to cooperation with developing countries. The DAC is a key forum
of major bilateral donors, who work together to increase the effectiveness of their common efforts to support sustainable development. The DAC concentrates on two key areas: the contribution of international
development to the capacity of developing countries to participate in the global economy and the capacity
of people to overcome poverty and participate fully in their societies.
For more information, see www.oecd.org.
Stockholm International Peace Research Institute
The Stockholm International Peace Research Institute (SIPRI) conducts research on questions of conflict and
cooperation of importance for international peace and security, with the aim of contributing to an understanding of the conditions for peaceful solutions to international conflicts and for a stable peace. SIPRI’s main
publication, SIPRI Yearbook, is an authoritative and independent source on armaments and arms control
and other conflict and security issues.
For more information, see www.sipri.org.
Understanding Children’s Work
As part of broader efforts to develop effective and long-term solutions to child labor, the International Labour
Organization, the United Nations Children’s Fund (UNICEF), and the World Bank initiated the joint interagency
research program “Understanding Children’s Work and Its Impact” in December 2000. The Understanding
Children’s Work (UCW) project was located at UNICEF’s Innocenti Research Centre in Florence, Italy, until
June 2004, when it moved to the Centre for International Studies on Economic Growth in Rome.
The UCW project addresses the crucial need for more and better data on child labor. UCW’s online database contains data by country on child labor and the status of children.
For more information, see www.ucw-project.org.
2012 World Development Indicators
xv
PARTNERS
United Nations
The United Nations currently has 193 member states. The purposes of the United Nations, as set forth in
its charter, are to maintain international peace and security; to develop friendly relations among nations;
to cooperate in solving international economic, social, cultural, and humanitarian problems and in promoting respect for human rights and fundamental freedoms; and to be a center for harmonizing the actions of
nations in attaining these ends.
For more information, see www.un.org.
United Nations Centre for Human Settlements, Global Urban Observatory
The Urban Indicators Programme of the United Nations Human Settlements Programme was established to
address the urgent global need to improve the urban knowledge base by helping countries and cities design,
collect, and apply policy-oriented indicators related to development at the city level.
With the Urban Indicators and Best Practices programs, the Global Urban Observatory is establishing a
worldwide information, assessment, and capacity-building network to help governments, local authorities,
the private sector, and nongovernmental and other civil society organizations.
For more information, see www.unhabitat.org.
United Nations Children’s Fund
The United Nations Children’s Fund (UNICEF) works with other UN bodies and with governments and nongovernmental organizations to improve children’s lives in more than 190 countries through various programs in
education and health. UNICEF focuses primarily on five areas: child survival and development, basic education
and gender equality (including girls’ education), child protection, HIV/AIDS, and policy advocacy and partnerships.
For more information, see www.unicef.org.
United Nations Conference on Trade and Development
The United Nations Conference on Trade and Development (UNCTAD) is the principal organ of the United
Nations General Assembly in the field of trade and development. Its mandate is to accelerate economic
growth and development, particularly in developing countries. UNCTAD discharges its mandate through policy
analysis; intergovernmental deliberations, consensus building, and negotiation; monitoring, implementation,
and follow-up; and technical cooperation.
For more information, see www.unctad.org.
United Nations Department of Peacekeeping Operations
The United Nations Department of Peacekeeping Operations contributes to the most important function of the
United Nations—maintaining international peace and security. The department helps countries torn by conflict to
create the conditions for lasting peace. The first peacekeeping mission was established in 1948 and has evolved
to meet the demands of different conflicts and a changing political landscape. Today’s peacekeepers undertake
a wide variety of complex tasks, from helping build sustainable institutions of governance, to monitoring human
rights, to assisting in security sector reform, to disarming, demobilizing, and reintegrating former combatants.
For more information, see www.un.org/en/peacekeeping.
xvi
2012 World Development Indicators