AWEA Small Wind Turbine
Global Market Study
Y E AR E ND IN G 2 0 0 8
Table of Contents
Summary............................................................................................................................................ 3
Survey Findings and Analysis............................................................................................................ 4
Current Market Status................................................................................................................ 4
Growth Potential And Projections.............................................................................................. 6
States......................................................................................................................................... 6
Potential Market Factors (See Also The 2008 Study)................................................................ 6
Investment............................................................................................................................... 10
Jobs......................................................................................................................................... 10
Displaced Carbon Dioxide....................................................................................................... 10
Building-Mounted Turbines...................................................................................................... 10
Manufacturing.................................................................................................................................. 11
Manufacturer Profile................................................................................................................. 11
Global Distribution of Manufacturers . .................................................................................... 11
Manufacturing Trends.............................................................................................................. 12
Comparison to Solar Photovoltaics ................................................................................................ 13
Growth..................................................................................................................................... 13
Costs........................................................................................................................................ 14
The Global Market . ......................................................................................................................... 15
The Us Position....................................................................................................................... 15
Feed-In Tariffs.......................................................................................................................... 16
United Kingdom....................................................................................................................... 16
Canada.................................................................................................................................... 16
Responding Manufacturers............................................................................................................. 17
Methodology.................................................................................................................................... 18
Bibliography and Other Resources.................................................................................................. 19
Small W ind Turbine Glo bal Market Study: 2 009
|
1
2
|
A M E RIC A N WIND E NE RGY AS S OCIAT ION
Summary
US Small Wind Market
grows 78% in 2008
Industry Secures Long-Term Federal Incentive –
the First Since 1985
The US market for small wind turbines – those with capacities of
100 kW1 and under – grew 78% in 2008 with an additional 17.3
MW of installed capacity. This growth is largely attributable to
increased private equity investment that allowed manufacturing
volumes to increase, particularly for the commercial segment of
the market (systems 21-100kW). The still-largest segment of the
market, residential (1-10kW), was likewise driven by investment
and manufacturing economies of scale, but also by rising
residential electricity prices and a heightened public awareness
of the technology and its attributes.
The industry projects 30-fold growth within as little as five
years, despite a global recession, for a cumulative US installed
capacity of 1,700 MW by the end of 2013. Much of this
estimated growth will be spurred by the new eight-year 30%
federal Investment Tax Credit passed by Congress in October
2008 and augmented in February 2009.
The market has become dominated by grid-connected units
and will likely continue in this trend as these larger systems
become more affordable.
The US continues to command roughly half the global market
share and is home to one-third of the 219 identified worldwide
manufacturers. Small wind is still in a race with the solar
photovoltaic industry toward “grid parity” – price per kilowatthour on par with conventional forms of electricity – and now
both industries enjoy nearly identical federal incentives for a
more level playing field.
2008 U.S. Sales
17.3 MW
78% growth over 2007
10,500 units
$77 million in sales
Other Statistics
• 80 MW of cumulative installed small-wind capacity
in the US.
• US manufacturers’ sales account for ½ the global market.
• $160 million in outside investment was injected into
18 manufacturers worldwide over the past three years.
• At least 219 companies worldwide manufacture small
wind systems, 35% of which are based in the US.
• Industry predicts a cumulative US capacity of 1,700 MW
within five years.
2008 Global Sales
38.7 MW
53% growth over 2007
19,000 units
$156 million in sales
Small W ind Turbine Glo bal Market Study: 2 009
|
3
Survey Findings and Analysis
CURRENT MARKET STATUS
Based on a survey of leading manufacturers, 2008 growth
was largely due to the availability of capital and inventory,
and the evolution of manufacturing economies of scale.
Private equity investment has allowed supply to catch up to a
demand that has been consistently strong over recent years.
Better manufacturer capitalization has led to an increase in
production volumes, sales forces, and technical support within
individual companies.
Leading external market factors include rising and volatile prices
of conventional electricity, state incentives, consumer education,
and an increased public concern for environmental issues.
Despite record growth, the residential (1-10kW) and
commercial (21-100kW) market segments showed an
approximate 20% downturn in late 2008 and early 2009
due to a broad economic recession, but also because of
typical sales drop-offs during winter months. Despite the
dip, early 2009 residential sales were still 15-20% higher
than in early 2008.
Commercial-sector customers have found difficulty securing
financing for the typically more expensive turbines in this
market, and have found Power Purchase Agreements (PPA)
to be a more attractive financing method.2 Commercial PPAs
enable businesses, schools, governments, and utilities to
consume renewable electricity while avoiding high capital
costs and risks associated with owning the generating
equipment. The PPA model has been very popular for the solar
photovoltaic (PV) industry in recent years primarily because
the federal investment tax credit created in the 2005 Energy
Policy Act provided a far more generous incentive (30% of the
total installed system cost) for commercial applications than
for residential, which was limited to $2,000. Small wind and
solar now enjoy a long-term, uncapped 30% tax credit for both
commercial and residential applications.
PPAs will likely become more popular in 2009 as the expanded
incentive takes effet and credit remains restricted throughout
the economy.
Table 1. Growth by Market Segment
US: Units, 2008
0-0.9kW
1-10kW
11-20kW
21-100kW
Totals
Off-Grid
6,706
696
0
0
7,402
On-Grid
0
2,825
72
87
2,984
Totals
6,706
3,521
72
87
10,386
US: kW, 2008
0-0.9kW
1-10kW
11-20kW
21-100kW
Totals
Off-Grid
2,784
980
0
0
3,764
On-Grid
0
6.619
1,331
5,660
13,610
Totals
2,784
7,599
1,331
5,660
17,374
World Total 2008
Units
kW
Off-Grid
13,902
7,536
On-Grid
4,992
26,065
Total
18,894
33,601
* Where confirmation was unavailable, this study assumes all turbines under 1kW, and 90% of turbines equal to 1kW, are off-grid. Several models can be used for either on- or off-grid applications.
4
|
A M E RIC A N WIND E NE RGY AS S OCIAT ION
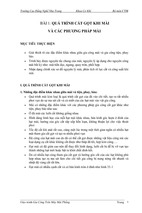
FIGURE 1: U.S. SMALL WInd TURBINE MARKET, 2008
10000
FIGURE 2: U.S. MArket Segment Growth
On-Grid
Off-Grid
8000
2006
2007
7000
2008
8000
6,619
6000
New Capacity (kW)
kW Sold in US
5,660
6000
4000
2000
0-0.9kW
4000
3000
2000
2784
980
0
5000
1-10kW
1000
1331
11-20kW
0
21-100kW
0-0.9kW
1-11kW
Turbine size range
11-20kW
21-100kW
Turbine Size Range
The market has become dominated by grid-connected units
and will likely continue in this trend as these larger systems
become more affordable and available.
The residential and upper-commercial market segments
experienced the sharpest growth in 2008.
FIGURE 3: GROWTH OF U.S. SMALL WInd MARKET
20000
78% Growth
15000
2008
14% Growth
10000
2007
73% Growth
2006
2005
5000
2004
2003
2002
2001
0
Units
kW
Sales ($US x 10,000)
Small W ind Turbine Glo bal Market Study: 2 009
|
5
For all market segments, industry predicts that the federal
investment tax credit (see “Potential Market Factors”) will
continue to help increase production and further reduce
consumer costs. The cleantech economy sector in general
has been relatively strong throughout the global recession and
credit crisis, and small wind is no exception. Even amidst the
downturn, economies of scale are beginning to take shape in
the industry and growth projections are the strongest in the
industry’s 80-year history.
FIGURE 4: U.S. MARKET GROWTH PROJECTIONS
2000
New
Cumulative
Megawatts (MW)
1500
manufacturing capabilities. This growth projection is much
greater than the 40-50% annual growth predicted in the 2008
study, and is far beyond the average annual growth of 14-25%
year-over-year growth the industry has seen over the past decade.
(See also “Potential Market Factors” and the 2008 AWEA study.)
STATES
In general, states that offer consumer incentives at a level of
$2 per Watt of capacity or greater attract the strongest share
of the small-wind market. Based on a survey of residentialturbine providers, states with highest sales percentages in
2008 were CA, NV, AZ, OR, NY, MA, and OH. New Jersey
and Hawaii would have been added to this list, say industry
members, were it not for their unusually cumbersome
permitting processes which have severely restricted their
markets.3 (See also “Potential Market Factors.”)
POTENTIAL MARKET FACTORS (See also the 2008 study)
1000
500
0
2006
2007
2008
2009
2010
2011
2012
2013
GROWTH POTENTIAL AND PROJECTIONS
Manufacturers predict a 30-fold increase in the US market
in as little as five years, even under current economic
conditions. Primary drivers include the eight-year 30% federal
investment tax credit enacted in October 2008, recent and
potential private equity investment, and greater equipment
New federal incentives. On October 3, 2008 Congress
passed the Emergency Economic Stabilization Act of 2008,
H.R. 1424, that includes a new eight-year, 30% federal-level
investment tax credit (ITC) to help consumers purchase
qualified small wind systems with rated capacities of 100
kilowatts (kW) and less. The amount of this credit was
stringently capped, however, until the passage of The
American Recovery and Reinvestment Act of 2009, H.R. 1,
on February 17, 2009 which removed the cost caps. A 30%
ITC is now available for small wind turbine consumers
through December 31, 2016. (For a list of other incentives
benefitting small wind contained in this legislation, see
www.awea.org/legislative/pdf/AWEA_Summary_ARRA_
Provisions_of_Interest_to_Small_Wind.pdf. See also the
Database for State Incentives for Renewables and Efficiency
Web site at http://dsireusa.org.)
Table 2. Grid-Tied Residential Market Potential
2010*
2020**
Homes with ½ to 1 acre of land
12.0
13.9
Homes with >1 acre of land
25.2
29.3
Gross potential number of homes for small wind turbines
37.2
43.2
Net potential number of homes for small wind turbines
13.0
15.1
†
* Millions of U.S. homes connected to the utility grid
**Growth according to U.S. Census Bureau, American Housing Survey, 1998.
†Approximately 35% of these homes will have a sufficient wind resource, defined as a U.S. Department of Energy wind class of 2 or better. To meet the electrical needs of a typical U.S.
home, a small wind turbine in a moderate wind regime must have a rotor diameter of 16 to 25 feet and be installed on a tower 60 to 150 feet tall. These dimensions are unsuitable for homes
on small lot sizes.
†† All data in this table is taken from the AWEA Small Wind Turbine Industry Roadmap (2002).
6
|
A M E RIC A N WIND E NE RGY AS S OCIAT ION
FIGURE 5: STATE POLICIES AND INCENTIVES
May 2007
November 2008
Residential Small Wind Incentives
Residential Small Wind Incentives
Property Tax Incentives
$ Income Tax Credits
Property Tax Incentives
$
$
Tax Credits
$ Income
$
$
$
$
$
$
$
$
$
$
$
www.dsireusa.org
$
$
$
$
$
$
$
$
$
$
$
$
$
$
$
$
$
$
Buydowns/grants
Buydown/Grants
Buydown/Grants
& Net Metering
Buydown /Grants,
Net Metering,
& Loans
RPS
Puerto Rico $
Productivity Incentives
Productivity
Incentives
& Loans
Net Metering,
Loans & Prod.
Incentives
$
Minor Incentives
Productivity
Incentives
Net Metering,
Loans & Prod.
Incentives
Loans
Net Metering
& Loans
Net Metering
Buydowns/grants
Buydown/Grants
Buydown/Grants
& Net Metering
Buydown /Grants,
Net Metering,
& Loans
RPS
Puerto Rico $
Productivity Incentives
Productivity
Incentives
& Loans
Net Metering,
Loans & Prod.
Incentives
Productivity
Incentives
Net Metering,
Loans & Prod.
Incentives
Minor Incentives
Loans
Net Metering
& Loans
Net Metering
Federal investment tax credits are available for turbines 100 kW and less.
Yearly grants through the USDA farm bill are available for Illinois, Pennsylvania,
Florida, Iowa, Wisconsin and Ohio.
Maps prepared by Trudy Forsyth of the National Renewable Energy Laboratory, using data from: DSIREUSA
Federal Incentives: Mainstay Energy – green tag purchase (CA excluded);
USDA Federal Farm Bill Title 9006 - grant for rural areas
This legislation marked the first federal incentive for the small
wind industry in over 20 years and provides the industry with
stable, long-term policy that has historically been out of reach
for other renewables industries. Industry members value its
passage as an important step toward achieving political parity
with solar photovoltaics (PV) industry, small wind’s market
counterpart, which has enjoyed a federal ITC since 2005.
State policies and incentives. At the state, utility, and local
levels, policies continue to be fragmented and constantly
changing across regions and even communities, as illustrated
in the maps above.
External investment. See “Investment,” page 10.
Top state, utility, and local policy goals for the industry
continue to be to:
• Increase the availability and size of financial incentives,
• Streamline zoning ordinances at the local or state level,
• Standardize grid interconnection rules and procedures,
and
• Implement or improve state/utility net metering policies.
Zoning/permitting. Poor or absent local permitting practices
thwart an estimated 1/3 of all potential small wind turbine
installations. Unnecessarily restrictive regulations, particularly
height limitations, can limit a turbine’s productivity, discourage
customers and investment, and repel local industry-related
businesses from communities. See the 2008 AWEA permitting
guidebook, “In the Public Interest: How and Why to Permit
for Small Wind Systems” at www.awea.org/smallwind/pdf/
InThePublicInterest.pdf.
Growth not just in sales, but in the number manufacturers,
dealers, installers, supply chain members, and industry
advocates has led to a larger industry presence at local levels,
forcing permitting issues to the fore in a greater number
communities. With an estimated 25,000 different local zoning
jurisdictions in the U.S.4, however, AWEA and industry members
are attempting to address permitting challenges at broader
levels including at state or even federal levels of government.
State and utility consumer incentive programs for renewables,
Since the federal incentive was not enacted until the end of
2008, and not expanded until early 2009, it is unlikely that it
was a primary driver behind the 2008 surge in sales.
Small W ind Turbine Glo bal Market Study: 2 009
|
7
particularly solar photovoltaics, have declined in recent years
due to constrained state and utility budgets and the introduction
and expansion of a federal investment tax credit (ITC).5 The
same may occur for small wind, which now enjoys a federal
ITC that some states see as a possible substitute for their own
incentive programs. Industry sees a need for the federal and
state incentives to work concurrently rather than as substitutes
in order to have the desired market stimulus.
A small handful of states have chosen to reduce their incentive
levels on a per-project basis in order to cut costs while assisting
the same (or larger) amount of consumers. The trend is not
universal, however, as other states have chosen instead to
expand their incentive programs with the help of increased
funds through the American Recovery and Reinvestment Act
of 2009 passed in February 2009.6
The economic recession. Sharp drops in commodity prices
in late 2008 and early 2009 have helped to lower the costs of
solar photovoltaic (PV) cells considerably, which are based on
the raw material polisilicon. Potential consumers have also
had greater difficulty securing affordable home improvement
loans since the beginning of the recession in fall of 2008,
affecting the residential small-wind market. Historically, small
wind has been considerably more cost-competitive than solar
PV on a cost per kilowatt-hour basis, but a surge in solar
investment, a head-start on federal incentives, and falling
FIGURE 6: U.S. RESIDENTIAL ELECTRICITY PRICE
12%
FIGURE 7: % OF ELECTRICTY SALES BY SECTOR
Average Retail Price, 2006 (8.90 cents/kWh)
Transportation, <0.5%
(9.54 cents/kWh)
Residential
(10.40 cents/kWh)
37%
Commercial
(9.46 cents/kWh)
35%
Source: US Department of Energy / Energy
Information Administration. www.eia.doe.gov/
Industrial
emeu/steo/pub/gifs/Fig21.gif
(6.16 cents/kWh)
28%
Source: US Department of Energy / Energy Information Administration.
production costs will likely result in PV costs at levels more
competetive with small wind.
Rising electricity prices. Residential electricity prices are
projected to rise at annual rates of about 1.1% in 2009 and
1.8% in 2010 and will likely contribute to a boost in smallwind sales.7 Higher prevailing rates for residential, industrial,
and commercial electricity make small wind turbines more
competitive with conventional electricity sources on an
incremental-cost basis. Intangible benefits of small wind,
such as providing a consistent and predictable supply and
cost of electricity for 20-30 years, could add to its overall
value to consumers.
10%
Utility policies. Recent years have seen a slight upward trend
in the quantity and quality of state/utility net metering laws and
practices (see “States”), but the policy is far from standardized
or universally implemented.
Change from Prior Year
8%
6%
4%
2%
0%
-2%
1998
2000
2002
2004
2006
Source: US Department of Energy / Energy Information Administration.
8
|
A M E RIC A N WIND E NE RGY AS S OCIAT ION
2008
Grid interconnection rules and procedures will also have an
increasing effect on the industry as the market continues
to shift toward grid-connected systems. While balkanized
and cumbersome interconnection rules and procedures
rarely thwart installations completely, they often magnify
installations’ time, expense, and complexity. The National
Fire Protection Association will likely create a section in its
National Electric Code (NEC) specifically for small wind
turbines in its next revision in 2011. This will explicitly list
electrical safety requirements for small wind turbines and in
turn help streamline grid interconnection processes. Electrical
safety has not historically presented a challenge to small wind
installations under existing NEC regulations, but proponents
of the advancement cite a need to establish small wind in
the Code as an investment in the industry’s future and as a
framework for growth.
Installer and equipment certification. Programs are nearing
completion to certify small wind turbine equipment and those
who install them by the Small Wind Certification Council
(SWCC)8 and the North American Board of Certified Energy
Practitioners (NABCEP)9, respectively. While both programs
will be voluntary, market forces are likely to institutionalize
them throughout the industry. A number of states have
indicated that they plan to make certification a requirement to
interconnect to the electricity grid, obtain a zoning permit, and/
or receive public incentive funds.
Increased public awareness. Small wind was the subject of
10% of all media inquiries at AWEA in 2008 – another recordbreaking year – while still comprising less than 1% of the wind
energy industry (in terms of 2008 installed capacity). Industry
reports that public exposure, which has been predominantly
positive, helps to highlight local policy needs and solutions,
generate consumer inquiries, and present the technology as
mainstream.
Federal renewable electricity standard. Legislation is
expected to be considered again in 2009 that would create a
nation-wide requirement for major utilities to derive a certain
percentage of their generation from renewable sources by a
certain date. Called a renewable electricity standard or RES,
this type of policy currently exists in 28 states and over 35
countries and has created a sustained market for renewables
in these areas. Depending on how the policy is structured, an
RES may provide an incentive for utilities to encourage smallscale, customer-sited renewables like small wind turbines to
be added to the generation mix. For more information on the
RES and other legislation, see www.awea.org/legislative.
All major RES bills proposed in the recent past would allow
electricity generated by distributed renewable generators,
like small wind systems, to be counted as three times as
valuable as electricity generated from centralized renewables.
This may provide incentives for utilities to own and operate
small wind systems, to encourage consumers to generate a
surplus of electricity, or to buy the environmental attributes
of a customer’s excess generation in the form of renewable
electricity credits, or RECs.
Federal climate change legislation. Congress may consider
legislation in the foreseeable future that would establish a
ceiling, or cap, on carbon dioxide (CO2) emissions allowed
on an economy-wide basis. Renewable energy systems like
small wind turbines, which emit no CO2, could become more
cost-competitive under this law.
In order to emit greenhouse gases within the cap, entities
would have to acquire pollution allowances, from the federal
government, either for free or through auction. Entities that
receive allowances but do not need them to offset their
emissions (because they produce little or no CO2) would then
be allowed to sell their allowances to others that do need
them. This system is known as “cap-and-trade.”
Depending heavily on the structure (and passage) of
this legislation, distributed renewable energy generation
technologies like small wind systems could benefit directly
and indirectly. In theory, federal auction proceeds could be
used to fund consumer incentive programs, and states and
utilities could receive incentives if they adopt policies that
support distributed renewables.
AWEA is actively advocating for climate change legislation
and that it includes provisions to help small wind. For more
information see www.awea.org/legislative.
Improved resource assessment technology. Average
prevailing wind speed is the second most significant factor
in a turbine’s rate of return on investment, behind only
financial incentives (see also “Costs” in the 2008 study).
Several private-sector companies have developed more
advanced technologies in recent years to identify geographic
regions with the greatest average wind speeds, and the
US Department of Energy released a Funding Opportunity
Announcement in 2008 calling for the development of a
consumer-friendly “site analysis tool” to benefit distributed
wind technology.10 These new tools could help future small
wind installations be more productive and offer consumers
more predictability on their investment.
Plug-in hybrid electric vehicles. The American Recovery and
Small W ind Turbine Glo bal Market Study: 2 009
|
9
Reinvestment Act, passed in February 2009, authorized $14.4
billion in incentives and loans for plug-in electric hybrid vehicle
(PHEV) consumers and producers.11 President Obama also
indicated in his presidential campaign his desire to have one
million PHEVs and electric vehicles on US roads by 2015.12 A
growing market for this technology would transfer a degree of
demand from oil to the residential electricity sector, and in turn
potentially to on-site renewable electricity generators like small
wind systems.
FIGURE 9: URBAN ROOFTOP TURBINE MARKET SHARE
100%
80%
60%
Wind-diesel hybrid systems. One quarter of turbines 50-100
kW sold in 2008 were used for wind-diesel hybrid applications
in remote locations, particularly Alaska and Canada.
Incentives for this application type are increasing in the US
and Canada, and manufacturers in this market segment note
an “unprecedented rise in demand.”
40%
20%
Tower-Mounted
Urban/Rooftop
INVESTMENT
The past three years have brought over $160 million in external
private equity investment to over 18 manufacturers worldwide,
about half of which are US manufacturers. This investment
was an important driver in the industry’s recent growth.
Ten percent of all venture capital in the US is invested in the
clean technology sector13 but continues to favor the solar
industry, which received $1.8 billion (nearly half) of all venture
funding for clean technology companies in 2008 despite a
global recession and a strained credit market.14
FIGURE 8: TOP VENTURE CAPITAL IN 2008
Clean Technology Sectors
Agriculture
Water
Smart
Grid
Transportation
2006
2007
2008
JOBS
The estimated number of jobs associated with the wind energy
industry, including small wind, will be released as part of a
separate, comprehensive AWEA study available in late 2009
at www.awea.org.
DISPLACED CARBON DIOXIDE
A single residential-scale turbine displaces the carbon dioxide
(CO2) produced by 1.5 average cars. The 80MW of cumulative
small-wind installed capacity in the US translates to:16
• 13,300 cars offset
• 9,200 equivalent number of homes powered
• 76,000 tons of CO2 displaced per year
BUILDING-MOUNTED TURBINES
Wind
(including electric
vehicles,
advanced batteries,
fuel cells)
0
Solar
Water 200 units were sold to be used for
In 2008 approximately
urban or rooftop applications in the US,17 representing less
Agriculture
than 250kW of installed capacity. This number still represents
less than 0.002% of the US small-wind market, but a slight
Smart Grid
increase over the approximately 100 units sold in 2007.
Biofuels
Wind
(including ethanol,
biodiesel,
synthetic biology,
algae)
Source: Cleantech Group, LLC
At least 10 US companies manufacture or plan to manufacture
building-mounted
models, a(including
high proportion
of which
are ofbatteries, fuel cells)
Transportation
electric vehicles,
advanced
vertical-axis configuration.
Biofuels (including ethanol, biodiesel, synthetic biology, algae)
Solar
10
|
A M E RIC A N WIND E NE RGY AS S OCIAT ION
Manufacturing
manufacturer PROFILE
At least 219 companies manufacture, or plan to manufacture,
small wind turbines in the world. Of these:
• Seventy-four (34%) are based in the United States.
• At least 36 (14 US) have begun sales.
• At least 45 (21 US) manufacturer or plan to manufacture
vertical-axis systems.18
• A minimum of five manufacturers (two US) began
sales in 2008.
Country
kW Sold
in 2008
US (AZ)
10,000
UK (Scotland)
4,800
US (VT)
4,300
Entegrity Wind Systems
Canada (PE) /
US (CO)
3,500
Bergey WindPower Co.
US (OK)
1,700
Company
Southwest Windpower
Proven Energy Ltd.
Northern Power
FIGURE 10: GLOBAL DISTRIBUTION OF MANUFACTURERS
Country (Number of Manufacturers)
US (66)
Sweden (5)
Israel (2)
Iran (1)
Japan (28)
South Africa (4)
Italy (2)
Kenya (1)
Canada (23)
Spain (4)
Russia (2)
Poland (1)
UK (18)
India (3)
Argentina (1)
New Zealand (1)
Germany (16)
Taiwan (3)
Australia (1)
Switzerland (1)
China (14)
Finland (2)
Austria (1)
Netherlands (7)
France (2)
Denmark (1)
Small W ind Turbine Glo bal Market Study: 2009
|
11
MANUFACTURING TRENDS
Manufacturing techniques hold a key to higher production
volumes and lower costs. In the fall of 2008 the US
Department of Energy held two workshops for stakeholders
to develop a research and development action plan for
the wind energy industry, including the small wind turbine
sector. Stakeholders identified the following manufacturing
needs from a research and development perspective, with an
overarching focus of lowering a turbine’s cost of energy:
Efficiency
• Blades: Improve efficiencies from approximately 32% to
42-45%
• Alternators: Improve efficiencies from 65-80% to 90-92%
• Inverters: Inverters offer less room for improvement,
as most are over 90% efficient. Most inverters used in
small wind turbines are adopted from those used in the
solar photovoltaic industry, which has focused heavily on
improving inverter efficiencies over past decades.
Design
• Continue to increase swept area19 to capture more energy
while minimizing design loads. This also may include the
use of new composite materials and molding processes.
• Reduce the number of components in a system.
• Research reliability issues pertaining to lightning,
corrosion, bearing lubrication, alternator winding
insulation, and electronics.
• Focus on “design for manufacturing” techniques.
12
|
A M E RIC A N WIND E NE RGY AS S OCIAT ION
•
•
•
•
Reduce the overall use of materials in terms of pounds
per Watt.
Minimize the use of moving parts and mechanical furling
systems.
Improve turbine performance in low-wind conditions.
Consider incorporating more technology from utility-scale
turbines such as gearboxes, mechanical breaks, upwind
rotor designs, active yaw control, stall rotor-control, and
variable-pitch blades, into commercial-scale (21-100kW)
designs.
Other
• Adopt advanced tower material designs to reduce
installation time and cost.
• Develop processes and tools that can more accurately
predict a turbine’s energy production at a given site.
• Establish robust and well-trained installer/dealer networks.
• Develop advanced tower foundations to decrease
installation time.
• Develop wireless and Web-based turbine performance
monitoring capabilities to minimize the frequency of site
inspections.
• Continue to develop and support performance standards,
certification, and third-party equipment testing sites.
The development of batteries and other forms of electricity
storage were determined not to be an industry priority or
focus. Market momentum is tilted heavily toward grid-tied
turbines which essentially use the electricity grid as a means of
“storage” and do not incorporate batteries.20
Comparison to Solar Photovoltaics
FIGURE 11 : NEW SMALL WIND VS. SOLAR PV
350
Solar PV
Small Wind
300
300
250
250
Megawatts (MW)
Megawatts (MW)
350
FIGURE 12: U.S. SOLAR PV GROWTH
200
150
200
150
100
100
50
50
0
2001
2002
2003
2004
2005
2006
2007
0
2008
On-Grid
Off-Grid
2001
2002
2003
2004
2005
2006
2007
2008
PV data source: Larry Sherwood; SEIA 24
See the 2008 AWEA market study for other trends and
comparisons.
for both commercial and residential applications.21 The federal
government now provides nearly identical incentives for the two
industries, except that the solar tax credit can be used by utilities.
GROWTH
In as little as three years the US small wind turbine industry
could match the 2007 record growth of the solar photovoltaic
(PV) industry in terms of annual installed capacity.
The US market saw 292 MW of grid-tied solar PV capacity
added in 2008 for a cumulative 792 MW. Cheaper raw
materials and improved manufacturing processes are lowering
prices for PV cells and panels, leading many companies to
predict that solar power could become cost competitive with
natural gas-fueled electricity as early as 2011.22
An uncapped, eight-year 30% federal investment tax credit
(ITC) is now available for both solar PV and small wind, and
FIGURE 13 : U.S. INSTALLATION FORECASTS 2008-2016 FOR SOLAR PHOTOVOLTAICS
Annual U.S. Installations (MW pDC)
8000
7000
6000
Accelerated, Current ITC
Conservative, Current ITC
Accelerated, Reduced ITC
Conservative, Reduced ITC
5,700 MW
5000
4000
3000
2000
2,150 MW
1,650 MW
1000
950 MW
0
2008
2009
2010
2011
2012
2013
2014
2015
2016
Year
Source: Navigant Consulting
Small W ind Turbine Glo bal Market Study: 2009
|
13
High prices of silicon-based modules in 2007 and early 2008
led to increased manufacturing investment that enabled higher
production volumes. But by late 2008 falling prices of the
key commodities of copper, aluminum, and especially silicon
(from a decreased global demand for semiconductor-based
consumer electronics) resulted in steep cost reductions for
solar PV production, a projected supply surplus, and much
lower consumer prices forecasted for 2009.25
A Lawrence Berkeley National Laboratory study27 reports that
state incentives helped push the installed cost of solar power in
the US down 28 percent between 1998 and 2007 and that costs
for residential PV declined from $10.50/Watt in 1998 to $7.60/Watt
in 2007. Factoring in average state/utility and federal incentives,
this average price drops to $5.10/Watt. Commercial PV averaged
a post-incentive $3.80/Watt in 2007, a 32% drop since 2001,
largely due to the uncapped ITC the commercial PV sector has
enjoyed since the Energy Policy Act of 2005.
Small wind systems are approximately 90% steel and
incorporate a significant amount of copper in their generators
and wiring, and are thus similarly susceptible to fluctuating
commodity prices. Steel prices nearly doubled in 2008 but
have dropped sharply back to near-2007 levels as of early
2009. Copper prices also dropped sharply to 2005 levels in
late 2008 and early 2009, likely due to the global recession
beginning that period.26
Prices for small wind continue to be widely scattered due to
the numerous factors affecting installation costs (see “Costs”
in the 2008 study), but tend to gravitate between $3-6/Watt.
Small wind turbine installations are far more constructionintensive than solar PV, which after its manufacture is largely
an electrical project. Expanding the federal ITC to small wind
will likely allow economies of scale to take effect and put
downward pressure on installed small-turbine costs.
COSTS
FIGURE 14: REAL MODULE PRICES AND ANNUAL GLOBAL PV INSTALLATIONS 1993-2008
4500
Real Module Price (2007 $/W)
$6.00
Global PV Installations (MW)
4000
$5.00
Increases in demand and prices
of aluminum, copper and silicon
3500
MW
2500
$3.00
2000
$2.00
1500
1000
$1.00
500
$0.00
0
1992
1994
1996
1998
Source: Navigant Consulting 23
14
|
A M E RIC A N WIND E NE RGY AS S OCIAT ION
2000
2002
2004
2006
2008
2007 $/W
$4.00
3000
The Global Market
THE US POSITION
According to a 2008 AWEA survey, US manufacturers
accounted for 49% of global small wind sales in 2008,
maintaining their historically dominant position.28
Exports accounted for approximately 28% of US
manufacturers’ sales (measured in capacity), a decrease
from 33% in 2007. An overwhelming majority (94%)
of units sold in the US in 2008 were produced by US
manufacturers, though this is a slight decrease from
98% in 2007. These trends may signify a growing
attractiveness of the US market.
US state and government incentives have begun to catch
up with those of other major turbine-producing countries.
Particularly with an uncapped ITC, the US appears
prepared to retain and improve its market share in the
global industry.
FIGURE 15: U.S. GLOBAL MARKET SHARE (kW)
100%
80%
60%
40%
20%
Rest of World
0%
FIGURE 16: U.S. MANUFACTURERS’ EXPORTS (kW)
20,000 20,000
2007
2008
FIGURE 17: U.S. MANUFACTURERS’ EXPORTS
as a percentage of sales (kW)
100%
100%
80%
80%
60%
60%
40%
40%
20%
20%
kW
kW
15,000 15,000
US Market
2006
10,000 10,000
5,000
0
5,000
0
2006
Export Export
DomesticDomestic
2006 2007
2007 2008
2008
0%
0%
2006
Export Export
DomesticDomestic
2006 2007
2007 2008
2008
Small W ind Turbine Glo bal Market Study: 2009
|
15
FEED-IN TARIFFS
UNITED KINGDOM
A growing global trend to implement feed-in tariffs (FITs), a
type of production-based financial incentive for small, on-site
renewable generators, has largely escaped the US policy
arena to date.29 A number of US states30 have introduced
legislation that would create a version of the FIT, but mostly
for solar PV technology, and as of March 2009 none has been
enacted into law specifically to benefit small wind systems.
For information about the small wind market in the United
Kingdom, see the British Wind Energy Association’s annual
market report at www.bwea.com/small/index.html.
Table 2: Feed-In Tariffs
Countries with Feed-In Tariffs
Australia
Italy
Austria
Japan
Canada
New Zealand
China
The Netherlands
Czech Republic
Portugal
Great Britain
South Africa
France
Spain
Germany
Switzerland*
Greece
Turkey
Ireland*
Ukraine
Israel*
USA
* Specifically benefits small wind technology.
Source: Paul Gipe, www.wind-works.org/articles/feed_laws.html
16
|
A M E RIC A N WIND E NE RGY AS S OCIAT ION
CANADA
Most Canadian provinces now offer some form of a net
metering policy, but all provinces but one – Saskatchewan
– lack financial incentives for small-wind consumers. The
Canadian Wind Energy Association (CanWEA) plans to
address this need by hiring a full-time Small Wind Advocate
in 2009 to work to secure federal and provincial incentives for
small wind.
Given the right incentive climate, CanWEA estimates that 30%
annual growth is possible in the Canadian market, particularly
in the commercial, wind-diesel hybrid, and remote/off-grid
community segments.
Responding Manufacturers
Every one of the 219 identified world small wind turbine
manufacturers was solicited for the 2008 AWEA small wind
manufacturing survey (see also “Methodology”). Of these, 44
responded and 36 had commenced production and sales by
the end of 2008.
Identified Mfrs:
219 (74 US)
Reporting
Mfrs: 44
(17 US)
Have Begun
Sales:
36 (14 US)
?
Table 3: Respondents to the 2009 AWEA Small-Wind Manufacturer Survey
Manufacturer
Primary Location
Manufacturer
Primary Location
Southwest Windpower†
US - AZ
Proven Energy, Ltd. †
UK
Bergey WindPower†
US - OK
Ampair Microwind
UK
US - MN
FuturEnergy
UK
Wind Turbine Industries Corp.
†
US - SD
Gual Industrie
France/Spain
†
US - CA
Windeco
Spain
Abundant Renewable Energy†
US - OR
Aeromax
Canada
Earth Turbines†
US - VT
True North Power Systems
Canada
US - VT
CleanField Energy
Canada
US - NV
Entegrity Wind Systems
Energy Maintenance Service
AeroVironment
Northern Power
Mariah Power
†
†
†
Aerotecture International, Inc.
†
†
Canada
US - IL
Windterra
Endurance Wind Power, Inc. †
US - UT
REDriven, Inc. †
Canada
Everfair Enterprises
US - FL
Quantum Wind
Canada
US - CA
Laydon Composites, Ltd.
Canada
Marquiss Wind Power*
Ventera
†
†
Canada
†
US - MN
Wind Simplicity
Canada
Viryd Technologies, Inc. †
US - CA
Aerocatcher
Germany
Green Energy Technologies†
US - OH
Windmission
Windation Energy Systems
US - CA
Wind Energy Solutions
Eoltec
France
Unitron
India
Iskra
UK
Kestrel Wind Turbines
South Africa
Gaia-Wind†
UK
Hannevind
Sweden
Gazelle Wind Turbines
UK
Aventa, Ltd.
Switzerland
Renewable Devices
UK
Coriolis Wind*
Israel
†
†
Denmark
†
Canada/Netherlands
* = No longer in production as of 3/2009
† = AWEA member as of 3/2009
Small W ind Turbine Glo bal Market Study: 2009
|
17
Methodology
All sales data reported in this study was obtained directly from
manufacturers through telephone interviews, e-mail contact, or
both. Responses were compared to previous years’ sales as
reported in 2007 and 2008 surveys.
For purposes of estimating installed capacity, this study
assumes that each turbine sold was also installed and that
the installation occurred within the same calendar year as the
sale. However, depending on the manufacturer’s sales cycle,
a turbine’s physical installation may occur after the calendar
year in which it is sold.
Sales in dollar amounts are based on average turnkey
installed system cost, which includes equipment, wiring, and
installation. This is done to reflect the economic impact of the
industry more completely than by reporting the cost of only the
turbine and tower, uninstalled. The cost for a given installation
can vary considerably given any number of factors (see page
9 of the 2008 AWEA Small Wind Turbine Global Market Study).
18
|
A M E RIC A N WIND E NE RGY AS S OCIAT ION
Bibliography and Other Resources
American Wind Energy Association (AWEA)
Wind Resource Maps
Small Wind Homepage www.awea.org/smallwind
Additional Resources www.awea.org/smallwind/toolbox2/
U.S. Department of Energy / Energy Efficiency and
Renewable Energy, www.eere.energy.gov/windandhydro/
windpoweringamerica/wind_maps.asp.
additional_resources.html
AWEA Small Wind Turbine Global Market Studies
•
•
•
•
•
2008
2007
2007 Data Amendment
2005
U.S. Small Wind Turbine Industry Roadmap.
State Policy Information
U.S. Department of Energy / Energy Efficiency and Renewable
Energy / Renewable Resource Data Center http://rredc.nrel.
gov/wind/pubs/atlas/maps.html.
Urban Wind Resource Assessment
Cace, et al. “Urban Wind Turbines: Guidelines for Small
Wind Turbines in the Built Environment.” Intelligent Energy,
Europe. February 2007. www.urbanwind.org/pdf/SMALL_WIND_
“Policies to Promote Small Wind Turbines: A Menu for State
and Local Governments.” American Wind Energy Association
2008. www.awea.org/smallwind/pdf/Policies_to_Promote_Small_
Encraft. “Warwick Wind Trials Project.” U.K., 2009.
Wind_Turbines.pdf
www.warwickwindtrials.org.uk
Database for State Incentives for Renewables & Efficiency
http://dsireusa.org.
R Phillips, P Blackmore, J Anderson, M Clift, A Aguilo-Rullan
and S Pester. “Micro-Wind Turbines in Urban Environments:
An Assessment.” BRE, Nov 30, 2007.
www.brebookshop.com/details.jsp?id=287572.
Bolinger, Edwards, Forsyth, and Wiser. “Evaluating State
Markets for Residential Wind Systems: Results from an
Economic and Policy Analysis Tool.” Environmental Energy
Technologies Division and National Renewable Energy
Laboratory. December 2004. http://eetd.lbl.gov/EA/EMP.
TURBINES_GUIDE_final.pdf
“City and County of San Francisco Wind Resource
Assessment Project.” California Energy Commission
Publication Number: 500-04-066 October 2004.
www.energy.ca.gov/reports/2004-10-13_500-04-066.pdf.
Solar Photovoltaic Industry Information
Solar Buzz www.solarbuzz.com
Solar Energy Industries Association (SEIA) www.seia.org
“Urban Wind Resource Assessment in the UK.” IT Power
ITP/0875, February 2007. www.urban-wind.org/pdf/Reports_
UrbanWindResourceAssessment_UK.pdf.
American Solar Energy Society (ASES) www.ases.org
Zoning and Permitting
Galen Barbose, Carla Peterman, and Ryan Wiser. “Tracking
the Sun: The Installed Cost of Photovoltaics in the U.S. from
1998–2007.” http://eetd.lbl.gov/ea/emp/reports/lbnl-1516e.pdf
“U.S Solar Industry Year in Review 2008.” Prometheus Institute
an Solar Energy Industries Association. www.seia.org/galleries/
pdf/2008_Year_in_Review-small.pdf.
“In the Public Interest: How and Why to Permit for Small
Wind Systems, A Guide for State and Local Governments.”
American Wind Energy Association, 2008. www.awea.org/
smallwind/pdf/InThePublicInterest.pdf
Green, Jim and Sagrillo, Mick. Zoning for Distributed Wind
Power: Breaking Down Barriers. National Renewable Energy
Laboratory, Conference Paper NREL/CP-500-38167. August
2005.
Small W ind Turbine Glo bal Market Study: 2009
|
19
- Xem thêm -