Do T. T. Tram, Nguyen K. Duy. Journal of Science Ho Chi Minh City Open University, 9(1), 75-89 75
The interaction of service quality, customer value, customer
satisfaction on customer’s behaviour intention using
cellular/mobile service in Ho Chi Minh City
Do Thi Thanh Tram1*, Nguyen Khanh Duy2
1
2
Shin Heung Dong Nai company, Vietnam
University of Economics Ho Chi Minh City, Vietnam
*Corresponding author:
[email protected]
ARTICLE INFO
ABSTRACT
Based on theoretical models of Cronin, Brady, and Hult
DOI:10.46223/HCMCOUJS.
(2000) and Wang, Lo, and Yang (2004), the purpose of this study
econ.en.9.1.177.2019
Received: January 16th, 2019
Revised: January 19th, 20219
Accepted: March 4th, 2019
Keywords:
cellular/mobile
telecommunication service,
customer satisfaction,
customer value, loyalty,
service quality
is to answer the following question: Does customer value, an
intermediary factor, affect service quality, customer satisfaction
and behavioral intentions? The research was conducted from a
sample of 194 consumers in Ho Chi Minh City. Scales of the
research were developed through Cronbach’s alpha test,
exploratory factor analysis EFA, Path Analysis which pointed out
that customer value is an intermediary factor in the cause and
effect relationship among the following factors: service quality,
customer satisfaction and behavioral intentions. This was due to
the fact that improvement satisfaction results in positive behavior
Cronin et al. (2000) such as loyalty, not only service quality but
also focus on customer value as well. Besides, the result of
research also found three components: network quality,
significant tangible impact on customer value, customer
satisfaction. It was undeniable that the service supplier should pay
attention to those factors in order to satisfy customers.
1. Introduction
In the era of information and technological advances, the need to communicate
increasingly becomes a fundamental need are two main reasons for mobile telecommunications
services to become commonplace and top priority of human life. The fast-growing market, the
number of suppliers involved in the market increase, the more battle to gain market share
between "old people", "new people" in the mobile telecommunication services Vietnam more
and more fierce, mass and hard.
Competitive strategies are also diversified such as pricing strategies, advertising,
promotion, discounts, customer care, quality of basic services as well as added-value services.
The above mentioned are not aimed at achieving the three most important competitive
76
Do T. T. Tram, Nguyen K. Duy. Journal of Science Ho Chi Minh City Open University, 9(1), 75-89
advantages of the business: quality of customer service (service quality), value of services
provided to customers added value services and customer satisfaction (Parasuraman, Zeithaml,
& Berry, 1998; Zeithaml, Berry, & Parasuraman, 1996).
Customer behavior research is one of the key issues of marketing research as well as the
marketing department of companies. Previous studies in mobile communications in Vietnam
were concerned with measuring service quality or the impact of service quality on customer
satisfaction resulting in loyalty; Nevertheless, customer value (customer service value),
customer behavior is rarely mentioned in the studies. Meanwhile, Cronin et al. (2000) in their
research on the relationship among four factors: service quality, service value, satisfaction, and
customer behavior in the 6 service sectors in the United States. Indirect service quality to
customer satisfaction through customer value, and customer value have a positive and
significant impact on customer behavior (behavior intention). Wang et al. (2004) using the
research model of Cronin et al. (2000) in the Chinese mobile telecommunications industry has
shown that service quality does not directly affect customer behavior.
2. Literature review and methodology
2.1. Service quality
It can be deniable that measuring service quality for specific industries is also of interest
to many authors in Vietnam (e.g., Dao, 2017; Phan, 2015;). Dao (2017) used the SEVQUAL
model to evaluate the quality of specialized supermarket services in Hanoi with the statistical
techniques described in the comparison between expectations and customers’ perception. This
approach is useful in measuring service quality and towards practical solutions, but has failed
to validate the rules of the effect of service quality with other related concepts in theory. Phan
(2015) presents a number of studies related to the relationship between service quality and
customer satisfaction or (or) loyalty in some areas (retail service in super general market in
Hanoi: with regression techniques, ATM card services of Military Joint Stock Commercial
Bank in Hanoi, FPT Internet services in Hanoi: multiple regression techniques, hotel services
in some hotels 3-star hotel in Danang: multiple regression techniques. Some researches in Phan
(2015) only survey the customer of a company, so it may be difficult to make sense in the
generalization to the whole. Because of the insufficient variation of the independent variables,
the two regression equations separately apply to the effect of the quality components of the
translation. Satisfaction and loyalty can lead to biases in estimation because satisfaction and
loyalty are not independent of each other but they have a causal relationship.
Review globally with and authors service quality is a catchy concept and has many
different definitions in this research the authors try to cover some key definitions i.e., according
to Edvardsson, Thomsson and Ovretveit (1994), service quality is the fulfillment of customer
expectations for service and satisfying their needs. In addition, service quality is also viewed as
the distance between customer expectations and perceptions when used through service
(Parasuraman et al., 1985, 1988).
Do T. T. Tram, Nguyen K. Duy. Journal of Science Ho Chi Minh City Open University, 9(1), 75-89 77
Regarding, the approach of Parasuraman et al. (1985, 1988), the initial model of service
quality measurement consisted of multiple components: Reliability, Responsiveness,
Competence, Courtesy, Communication, Credibility, Security, Understanding the customer.
Then, in 1988, Parasuraman et al. (1988) modified and modeled the SERVQUAL model to
measure service perceptions through five components, including:
1. Reliability: demonstrates the ability to deliver the right service on time.
2. Responsiveness: performs the willingness of service personnel to provide timely
service to customers.
3. Service capacity (assurance): shows the professional level and the way to serve
courtesy, hospitality with customers.
4. Empathy: express the care and attention to each individual customer.
5. Tangible means (tangibles): represents through the appearance, dress of service
personnel, equipment to provide services.
The five-component SERVQUAL model was also applied by Cronin and Taylor (1992).
However, each service sector in different markets may have specific characteristics to adjust;
For example, with the service quality in the mobile telecommunications sector, in addition to
these five basic components, network quality (Wang et al., 2004); In particular, the quality of
the network consists of five aspects: (1) the quality of the network call is in good use, rarely
dropped, interference; (2) Mobile networks provide more added value services at reasonable
and competitive prices; (3) Mobile networks are using wide coverage, easy to communicate at
all times; (4) make successful calls during peak hours; (5) Can connect and make calls from the
first call. This paper uses the service quality measurement model of Cronin and Taylor (1992),
and Cronin et al. (2000), Wang et al. (2004) and adapts it for the market for mobile
telecommunication services in Ho Chi Minh City.
2.2. Customer satisfaction
Satisfaction is the process of customer feedback about the product or service that the
product or service meets their needs and expectations (Zeithaml & Bitner, 2000). The gap
between needs and expectations is the level of satisfaction. Satisfaction is the level of a person's
sense of place that results from comparing the results obtained from the product (or output)
with his or her expectations (Kotler, 2001). In addition, according to Kotler, Amstrong,
Saunders, and Wong (1997), customer satisfaction is their sense of either satisfaction or
disappointment that results from the comparison between the cognitive performance of a
product in a relationship with their expectations.
There are two levels of service satisfaction: service satisfaction provided by the
provider, and service preferences (expressed by emotion) (Oliver & Bearden, 1985). Studies by
Cronin et al. (2000) offer customer satisfaction for service providers in two levels: having
78
Do T. T. Tram, Nguyen K. Duy. Journal of Science Ho Chi Minh City Open University, 9(1), 75-89
feelings (likes, dislikes, anger, surprise) and satisfaction. In this study, the concept of
satisfaction only revolves around satisfaction (lightly level).
2.3. Customer value
The issue of value creation or added value has been widely discussed in specialized
marketing and consumer articles, which are often seen as key parts of mission statements and
organizational goals. The value of service is viewed as an important variable of customer
satisfaction and behavior (McDougall & Levesque, 2000). Zeithaml (1988) describes the
concept of perceived value as the general appreciation of the customer for the usefulness of a
product based on perceptions of what is received and what is lost. The author also identifies
four definitions of value through qualitative research of clients in their research: (1) Value is
low or high, (2) Value is what I want in a product (3) Value is the correspondence that I received
at paid price, (4) Value is what I got back for what I lost. In general, the value is the trade-off
between the gain (profit/benefit) and loss (loss /cost).
Cronin et al. (2000) in the study of the effects of service quality, value and customer
satisfaction in the six service sectors in the United States used the (3) and (4) definitions to form
the conceptual scale service value. In the integrated model study for the factors: service quality,
customer value perceived from the service, customer satisfaction in the Chinese mobile
telecommunications market, Wang et al. (2004) used the notion of customer value for his
research model rather than service value, but based on definition (3) and (4) of Zeithaml (1988)
on the concept of service value. In order to design a dimension scale and add a variable with
the statement: Compared to competing vendors, the service provider I am using is the better
choice. In this study, the author uses the two-variable scale of Wang et al. (2004) for the concept
of customer value (similar to two variables in the original dimension scales of Zeithaml (1988),
and Cronin et al. (2000). From the literature, it can be clear in the context of mobile
telecommunication service that the chosen service is value for money and is worth what is given
up such as time, energy and effort.
2.4. Behavior intention
The goal of marketing is to meet and satisfy the needs and desires of the target
customers. Customer Behavior Category studies how individuals, groups, organizations choose,
purchase, use goods and services, ideas to satisfy their customer’s needs. With regard to
learning behavior, this is not a simple task; it's art (Vu, 2002). Customer behavior is a field of
study that has roots in the sciences such as psychology, sociology, psychology of sociology,
humanities and economics. The American Marketing Association (AMA) defines consumer
behavior as a reciprocal relationship, the impact of perception, emotion, and behavior. That also
means consumer behavior includes their emotions, thoughts, and behaviors in the buying
process. At the same time, it also includes the environment that affects the consumer's emotions,
perceptions and behaviors, such as other people's comments, advertising, product price
information, the appearance of the product, etc.
Do T. T. Tram, Nguyen K. Duy. Journal of Science Ho Chi Minh City Open University, 9(1), 75-89 79
Furthermore, another viewpoint from philosophy of psychology Engel, Blackwell, and
Miniard (1995) show behavioral intentions related to attitudes. The traditional view reflects that
attitude consists of three main components: (1) one's perception, understanding, and belief in
one's attitude, (2), (3) a person's perception, action or behavior. Zeithaml et al. (1996) suggest
that customer preference behavior is related to the ability of a service provider to: (1) say good
and positive about them, (2) introduce the provider service to others, (3) become their loyal
customer, in particular, continue to use the service of the company, (4) accept to pay higher
than others. Thus, customer behavior in the context of the mobile telecommunication market is
choosing a mobile service provider today the user chooses their present service provider again.
Moreover, they are sure to recommend the using network and the user will keep close
relationships with this service provider.
Link the concepts:
This research may have newer academic contributions compared to Phan (2015), Dao
(2017) is in the context of the mobile information sector in HCMC (a dynamic city venture)
based on customer perception with many different companies at the time of the survey in 2018
when the public's interest in the 4.0 industrial revolution was greater; At the same time, the
author cares about two more research concepts in a model that are estimated simultaneously
with Path Analysis: value of service, customer behavior; estimation using Path Analysis
minimizes bias compared to individual regression equations when the dependent variable
models are not independent of each other, and there are intermediate variables. Although there
are inherent ways of measuring research concepts of Cronin et al. (2000) and Wang et al. (2004),
this study has adapted to a dynamic market (HCMC) in a developing country (Vietnam) in the
context of 2018. In addition, this study is not only concerned with the effect of service quality
[in general] on other concepts that may have more detailed implications for the impact of each
component concept (i.e., service quality to customer service value, customer satisfaction and
behavior intention). This study concerns not only direct effects but also indirect effects as well
as aggregate effects.
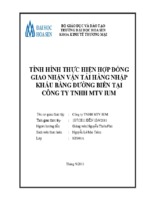
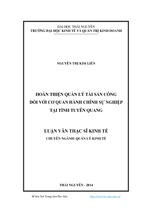
2.5. Research model
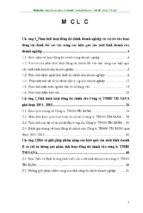
The research model of the paper is based on the research model of Cronin et al. (2000)
and added network quality in service quality to Vietnam's mobile telecommunication services
sector (Figure 1). In the research model, six hypotheses are expressed as follows:
80
Do T. T. Tram, Nguyen K. Duy. Journal of Science Ho Chi Minh City Open University, 9(1), 75-89
Figure 1. Research model
Hypothesis H1: Service quality has a positive and significant influence on customer
value.
Hypothesis H2: Service quality a positive and significant influence on customer
satisfaction.
Hypothesis H3: Customer value has a positive and significant influence on customer
satisfaction.
Hypothesis H4: Service quality has a positive and significant influence on consumers
behavioural intentions (behavior intention).
Hypothesis H5: Customer value has a positive and significant influence on consumers’
behavioural intentions (behavior intention).
Hypothesis H6: Customer satisfaction has a positive and significant influence on
consumers’ behavioural intentions (behavior intention).
The components of the quality of mobile information services in HCMC will be adjusted
after the actual data collection, scale reliability analysis as well as exploratory factor analysis.
3. Research methodology
The study was conducted in two phases: (1) qualitative research by group discussion of 10
people aged 23-54, including students, employees, staff (with different level of educational
Do T. T. Tram, Nguyen K. Duy. Journal of Science Ho Chi Minh City Open University, 9(1), 75-89 81
background, occupation) who using mobile services such as Mobifone, Vinaphone, Viettel; (2)
quantitative research with questionnaires emailed and face-to-face interviews with a scale used
as a Likert scale of 5 points, from 1 being totally disagreed to 5 being totally agree. In particular,
the scale is based on the original scale from the previous studies (see Table 1), but adjusted to
suit the mobile telecommunication sector in Vietnam.
Table 1
Dimension (scales) for research concepts
Research concepts (constructs)
Original dimension (scales)
Service quality
(Network quality)
Customer satisfaction
Customer value
Behavior intention
Cronin and Taylor (1992)
Wang et al. (2004)
Cronin et al. (2000), Wang et al. (2004)
Cronin et al. (2000), Wang et al. (2004)
Wang et al. (2004)
Source: Summary by the authors.
The reliability and validity of the conceptual dimensions of the research model were
assessed using the Cronbach's alpha coefficient and the exploratory factor analysis technique.
Path analysis is used to test hypotheses. SPSS, AMOS software is used to support this analysis.
In addition, the authors also perform descriptive analysis; The stability of the results by
regression technique, correlation coefficient, but due to the limit of page numbers should not
be presented in the article (readers who wish to contact the author via email for further details).
4. Research result and discussion
4.1. Data description (characteristic of respondents)
In order to collect data, this research conducted a convenience survey from 01 of April
to 31 of May in 2018 in Ho Chi Minh, Vietnam. Convenience sampling method was used to
collect data from customers (people who using mobile services Mobifone, Vinaphone, Viettel
and other network providers in Ho Chi Minh City. The questionnaire was translated into
Vietnamese, being printed and then distributed to customers with the help of friends and
relatives. Finally, of the 300 surveys individually administered, 208 questionnaires were
received at a response rate of 69.33 percent, of which 14 questionnaires were invalid due to
lack of information. On further filtering, 194 responses were found to be completely filled and
can be used for analysis. These 194 samples are sufficient for the purpose of this study. As a
result, 194 valid questionnaires (93.27%) were used as research data. The basic attributes of
respondents are summarized: surveyed clients are male (40%), female (60%). Among the
sample collected, male respondents make up 40% percent while female respondents are 60%
percent. Most of them are the subscriber of Viettel (46.4%), meanwhile, the subscriber of
MobiFone and VinaPhone provider are 30.4 percent and 21.6 percent respectively. These three
providers account for 98.5 percent of respondents. In terms of the type of contract, most of the
82
Do T. T. Tram, Nguyen K. Duy. Journal of Science Ho Chi Minh City Open University, 9(1), 75-89
respondents (72.2%) are pre-paid, while the rest (27.8%) of respondents account for post-paid
services. Respondents in the age group 23-34 (74.2%) are the majority, while respondents in
the age group under 23 accounts for 15.5 percent. In other words, respondents in the age group
under 35 contribute to 89.7 percent of the sample collected, while 8.2 percent of respondents
are the age group 35-44. The majority of respondents are single (65.5 %), and the rest of the
respondents (34.5%) are married. The frequency distribution for monthly total income are as
follows: is less than 5 million (11%), 5-10 million (about 56%), 10-20 million (24%) and the
rest is over 20 million. On occupation, the majority is private employees and small traders
(35%), students (4%) and the remaining occupation is (27%).
4.2. Assessment of reliability by Cronbach’s Alpha value for all research constructs
(concepts) (included all indicators)
Before conducting any other analyses, it is essential to assess reliability in any
measurement scale. The reliability of items was assessed by computing the coefficient alpha
that measures the internal consistency of the items. For a measure to be acceptable, the
Cronbach’s alpha should be above 0.7 while the item-to-total correlations exceed 0.50 (Hair et
al., 2009).
Reliability dimension (5 variables: RL1, RL2, RL3, RL4, RL5). This dimension consists
of 5 variables. Cronbach’s alpha of reliability dimension is 0.776 higher than 0.7, hence the
measurement of reliability dimension of service quality is acceptable. Meanwhile, the corrected
item-to-total correlation of RL1, RL5 doesn’t exceed 0.5; hence RL5 will be eliminated in
further analysis. Other items (i.e., RL2, RL3, and RL4) reached measurement standards and
will be used in other analyses. Thus, the initial confidence scale consists of five variables, and
only three variables (RL2, RL3, RL4) are retained for subsequent analyzes. With two
disqualified variables (RL1 and RL5), the information of the RL1 variable may be unclear and
is already expressed in another variable more clearly; Removed RL5 variable may explain that
the respondent has different perspectives when evaluating this question. Nowadays, the status
of spam messages is widespread (although controlled), which also causes troubles for many
customers, and they will send requests to call/message center (or service providers) not to
receive notifications. (e.g., MobiFone network subscribers refuse to receive notification
messages, compose messages to the automatical center operator 9234- switchboard).
Assurance dimension (4 variables: A9, A10, A11, A12) Cronbach's alpha of assurance
dimension is 0.830 higher than 0.7, so the measurement of assurance dimension of service
quality is acceptable. Meanwhile, the corrected item-to-total correlation of A12 doesn’t exceed
0.5; hence A12 will be eliminated in further analysis. In terms of the meaning of the A12
variable, it is difficult for customers to assess the knowledge of the mobile service provider’s
employee. Regarding, the rest items of assurance dimension reached the standard measure of
item-total correlation (exceed 0.5); so will be used in other analysis.
Responsiveness dimension (3 variables: RS6, RS7, RS8), Empathy dimension (4
variables E13, E14, E15, E16), Tangible dimension (5 variables: T17, T18, T19, T20, T21),
Do T. T. Tram, Nguyen K. Duy. Journal of Science Ho Chi Minh City Open University, 9(1), 75-89 83
Network quality dimension (5 variables: N22, N23, N24, N25, N26) the Cronbach’s alpha are
0.85, 0.896, 0.881, 0.912 respectively higher than 0.7, hence the measurement of these
dimensions of service quality are acceptable. All items of the above-mentioned dimension
reached the measurement standard of item-total correlation (exceed 0.5); thus they will be used
in other analyses.
Reliability analysis of measurement scale of Customer value (2 variables: CV27, C28),
Customer Satisfaction (3 variables SAT29, SAT30, SAT31), Behavioral intention (BI32, BI33,
BI3) the Cronbach’s alpha are 0.85, 0.896, 0.881, 0.912 respectively higher than 0.7, hence the
measurement of these dimensions are acceptable. All items of the above-mentioned dimension
reached the measurement standard of item-total correlation (exceed 0.5); thus they will be used
in other analysis.
4.3. Exploratory Factor Analysis (EFA)
4.3.1. EFA for service quality
Thus according to the analysis result of Cronbach’s Alpha, all 23 variables were
analyzed using the Principal Axis Factoring method with the Promax rotation. The variables
with factor loading less than 0.5 would be eliminated and priority should be given to eliminating
the variable. the "worst"; repeat the operation until the variable output table has a load factor of
less than 0.5. However, no variables are excluded because they all load factors that meet the
requirements. After the EFA, the measure of service quality consists of 23 variables which were
initially grouped into 5 factors instead of six as originally planned. The four factors (reliability,
empathy, tangible, network quality) are kept unchanged, with three variables (A9, A10, A11)
of the capacity factor and three variables (RS1, RS2, RS3). The response (mentioned) factors
are previously grouped into a new factor and renamed to Personnel.
The KMO value is 0.862 (> 0.5), Bartlett's test also indicates that the values are
significant (Sig. <0.05) is acceptable (>0.5). Besides, the total variance was 71.49% (>50%)
which represented five factors that accounted for 71.49% of 23 variables and thus acceptable.
Based on the above-mentioned result, EFA is an appropriate method.
4.3.2. FEA for customer satisfaction, customer value, behavior intention
For these scales (constructs), factor analysis is done in turn for each concept among
indicators. The results of the EFA analysis show that all variables have a load factor greater
than 0.5, the total covariance of the factors is greater than 50% showing the variability explained
and the conditions in the analysis. EFA. The observational variables measuring the concepts
remain unchanged from the expected. Specifically, customer satisfaction: 3 variables, customer
value: 2 variables, behavior intention: 3 variables. Hence, all of these variables will be included
in the path analysis.
84
Do T. T. Tram, Nguyen K. Duy. Journal of Science Ho Chi Minh City Open University, 9(1), 75-89
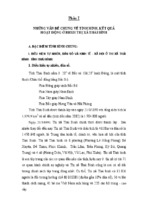
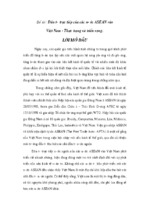
4.4. Statistical hypothesis testing (by Path Analysis)
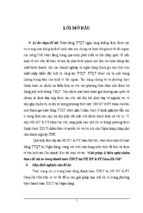
Figure 2. Standardized Path Analysis diagram
As a result of the EFA, the composite variables representing each factor are calculated
by adding the average value of the observed variables in terms of every construct (and total
indicators). The Path Analysis model is shown in Figure 2. In the model, the service quality
(SQ) in the HCM City market is measured through five aggregate variables. An abbreviation
formed meaning: R: Reliability (R); P: Personnel; E: Empathy; T: Tangible - Tangible means;
N: Network quality. In addition, there are some synthetic variables that represent other
unidirectional concepts: CV: Customer value; SAT: Customer satisfaction; BI: Behavior
intention.
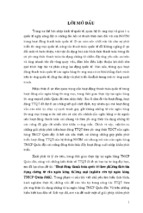
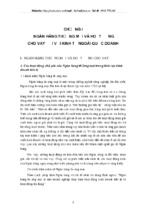
Table 2
Summary direct, indirect and composite impacts (standardized)
CV
RL
T
N
E
P
CV
SAT
Direct
-0.089
0.359***
0.357***
-0.007
0.117
0.000
0.000
Indirect
0.000
0.000
0.000
0.000
0.000
0.000
0.000
Total
-0.089
0.359
0.357
-0.007
0.117
0.000
0.000
Direct
-0.032
0.225***
0.181***
0.015
0.122*
0.407***
0.000
Indirect
-0.036
0.146
0.145
-0.003
0.048
0.000
0.000
Total
-0.069
0.372
0.327
0.012
0.170
0.407
0.000
SAT
Do T. T. Tram, Nguyen K. Duy. Journal of Science Ho Chi Minh City Open University, 9(1), 75-89 85
RL
T
N
E
P
CV
SAT
Direct
0.106
-0.065
-0.021
-0.003
0.593***
0.024
0.022
Indirect
-0.004
0.017
0.016
0.000
0.007
0.009
0.000
Total
0.102
-0.048
-0.005
-0.003
0.600
0.033
0.022
BI
Note: *, **, *** The direct effects are statistically significant at 10%, 5%, and 1%
Source: The researcher’s data analysis
As can be seen from the Table 2, it illustrates that the two components (indicators) of
service quality constructs are (1) tangible and (2) network quality which has a direct, positive
impact on service value at 1% level (standardized coefficients are 0.359 and 0.357 respectively).
These two components (indicators) also act directly (indirectly) and indirectly (on the positive
side) to customer satisfaction (T and N indirectly influence the SAT through the CV). In
addition, customer satisfaction is directly influenced by service value at a 1% level (with a
statistically significant value of 0.407).
As shown, Table 2 also demonstrates the direct and statistically significant (at 1%
significance) impact of the human factor component (indicator) on behavior intention (with
standardized coefficients value is 0.593). The human factor also indirectly influences behavior
intention through the customer value (indirect standardized coefficients value is 0.007). On the
sample scale, among the components (indicators) of service quality construct, the only human
component that explains and plays the most important role in influencing behavior intention
(direct relationships between other parts with BI construct is not statistically significant. The
synthetic effect is 0.6, the highest in absolute terms).
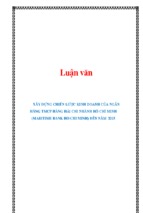
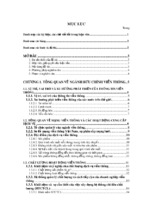
According to the results of direct, indirect, and combined effects (in Table 2), the direct
effects between concepts (constructs) as well as the P-value of the regression coefficients
(standardized and unstandardized) are shown in Table 3. The overall level of explanation for
the model is 84%.
The empirical results of this research in Viet Nam provide evidence that supports or
does not support the hypotheses H1, H2, H3, H4, H5, and H6 differing significantly from that
of Wang et al. (2004) made in China's mobile telecommunications market. Wang et al. (2004)
concluded that the quality of the network quality, sympathy and tangible means are the three
main drivers of customer value in the Chinese mobile telecommunication market, and this study
also finds similarities. In contrast with Wang et al. (2004), this study found no evidence to
support the influence of Empathy on customer value. The reason for this disagreement might
be that the majority of Vietnamese subscribers are pre-paid, mostly "trendy" (23-34 year olds),
who are apt to switch when facing problems with service providers. This also explains why
Reliability and Personnel are not the key drivers of customer value on Vietnam’s mobile
telecommunication market. This also explains why the trustworthiness and human factor
reflected in service quality is not a major factor in customer value in Vietnam's mobile
telecommunications market (although the human factor has a direct impact on behavior
intention).
86
Do T. T. Tram, Nguyen K. Duy. Journal of Science Ho Chi Minh City Open University, 9(1), 75-89
Table 3
Unstandardized, standardized statistical items (correlation between variables estimated), pvalue và R square
Estimates
Unstandardized
Standardized
S.E.
C.R.
P-value
CV
<---
P
0.126
0.117
0.078
1.625
0.104
CV
<---
RL
-0.081
-0.089
0.066
-1.237
0.216
CV
<---
N
0.339***
0.357
0.064
5.343
0.000
CV
<---
T
0.357***
0.359
0.067
5.344
0.000
CV
<---
E
-0.008
-0.007
0.061
-0.132
0.895
SAT
<---
CV
0.455***
0.407
0.074
6.186
0.000
SAT
<---
N
0.192***
0.181
0.07
2.766
0.006
SAT
<---
P
0.147*
0.122
0.08
1.841
0.066
SAT
<---
T
0.251***
0.225
0.073
3.422
0.000
SAT
<---
E
0.018
0.015
0.063
0.29
0.772
SAT
<---
RL
-0.033
-0.032
0.067
-0.488
0.625
BI
<---
P
0.699***
0.593
0.083
8.371
0.000
BI
<---
E
-0.003
-0.003
0.065
-0.049
0.961
BI
<---
N
-0.022
-0.021
0.073
-0.298
0.765
BI
<---
T
-0.071
-0.065
0.078
-0.904
0.366
BI
<---
RL
0.105
0.106
0.07
1.507
0.132
BI
<---
CV
0.026
0.024
0.083
0.315
0.753
BI
<---
SAT
0.022
0.022
0.074
0.291
0.771
R2
CV
0.410
SAT
0.507
BI
0.445
Total
0.839
Source: Data analysis result of the research
Wang et al. (2004) investigated the effect of quality-related factors on customer
satisfaction using SEM in China’s telecommunication industry. Their results indicated that
service quality had positive and significant effects on customer satisfaction. Furthermore, they
suggested that Reliability, Assurance, Tangible and Network quality were the key drivers of
customer satisfaction. Woo and Fock (1999), on their research investigated the determinants of
customer satisfaction in Hong Kong mobile phone service, identified transmission quality and
Do T. T. Tram, Nguyen K. Duy. Journal of Science Ho Chi Minh City Open University, 9(1), 75-89 87
network coverage as the key driver in the mobile phone market. Cronin et al. (2000) found
support for the indirect effect of service quality on customer satisfaction through customer
value. Moreover, the positive and significant influence of service quality on customer
satisfaction also found support from Cronin et al. (2000), Turel and Serenko (2006).
5. Conclusion and management findings
The research of correlation and causal effects revolve around four concepts: components
of service quality, customer value, customer satisfaction, and behavior intention. This study
confirms the effect/impact of service quality on customer satisfaction. Value of service has an
intermediary role in the causal relationship between service quality and customer satisfaction.
There is no statistical evidence of the direct impact of customer value and customer satisfaction
on behavior intention, the human factor in service quality has a direct impact on customer
satisfaction, as well as behavior intention.
Detecting the relationship between concepts (constructs) based on indicators in this
important marketing field is significant in quantifying and confirming the manager's ability to
plan strategies for achieving expecting business success, and key factor operating excellence.
Research results represent that in the service quality, the network quality (expressed by voice
quality) and then the tangible component (expressed through the infrastructure equipment, Base
Transceiver Station-BTS) should be of interest to the providers. Service providers investing in
developing modern infrastructure to increase signal transmission and improve network quality
are indispensable. In addition, the typical human factor is an attitude of service that implies a
psychological impact on customer perception of service. However, it should not be neglected
to maintain or increase the reliability factor as well as other factors of service quality, as it may
directly affect customer satisfaction and value. Existing research sample (based on nonprobability sampling method), this study has not found statistical evidence.
It can be denied that limitations of scientific research topics due to limited capacity and
time during implementation, the topic is not avoided from the following limitations:
First of all, because of using a convenient method, the number of small samples cannot
be completed.
All are highly representative, in which case the method should be chosen sample that is
more representative: stratified sampling, grouping. Second, in the process transliteration from
questions asked corresponding to the variables in the original English question head to the
Vietnamese questionnaire despite trying but inevitably mistakes, though try to explain in detail
the questions that the respondents can understand and avoid understanding wrong for the
respondents. Third, research is done in a specific industry (mobile information) needs to be
expanded. Experimental research for other sectors should be carried out to test the reliability of
the scale (especially the scale of customer value) and the appropriateness of the model and
consideration in the aggregate for the whole service industry. Fourth, the research is only done
in Ho Chi Minh City. This limits the level the generalization of the results at some level. In the
future, it should be done with wider scope whereby the level of generalization will also increase.
88
Do T. T. Tram, Nguyen K. Duy. Journal of Science Ho Chi Minh City Open University, 9(1), 75-89
ACKNOWLEDGEMENTS
The authors sincerely thanks for the support and encouragement of some scientists:
Master. Hang Le Cam Phuong, Dr. Vu The Dung, Ass. Prof. Dr Nguyen Hau, and lecturers at
the Faculty of Industrial Management (HCMC University of Technology). This study was
hardly completed without the support of the interviewees who answered questionnaires and we
would like to share this paper with friends and relatives.
References
Adil, M., Ghaswyneh, O. F. M. A., & Albkour, A. M. (2013). Servqual and servperf: A review
of measures in services marketing research. Global Journal of Management and Business
Research Marketing, 13(6), 65-69.
Anderson, J. C., Jain, D. C., & Chintagunta, P. K. (1992). Customer value assessment in
business markets: A state-of-practice stud. Journal of Business to Business Marketing,
1(1), 3-29. doi:10.1300/J033v01n01_02
Cronin, J. J., & Taylor, S. A. (1992). Measuring service quality: A re-examination and extension.
Journal of Marketing, 56(3), 55-68. doi:10.2307/1252296
Cronin, J. J., Brady, M. K., & Hult, G. T. (2000). Assessing the effects of quality, value, and
customer satisfaction on consumer behavioral intentions in service environments. Journal
of Retailing, 76(2), 193-218. doi:10.1016/S0022-4359(00)00028-2
Dao, K. X. (2017). Mô hình chất lượng dịch vụ trong bán lẻ: Giải pháp dành cho doanh nghiệp
bán lẻ và doanh nghiệp kinh doanh dịch vụ. [Service quality model in retail: Solutions
for retail and service businesses]. Hanoi, Vietnam: NXB Công Thương.
Edvardsson, B., Thomasson, B., & OvretVeit, J. (1994). Quality of service: Making it work.
New York, NY: McGraw-Hill.
Engel, J. F., Blackwell, R. D., & Miniard, P. W. (1995). Consumer Behavior (6th ed.). New
York, NY: Dryden Press.
Hoang Trong, & Chu, N. N. M. (2005). Phân tích dữ liệu nghiên cứu với SPSS. [Analyzing
research data with SPSS]. Hanoi, Vietnam: NXB Thống kê.
Kotler, P. (2001). A framework for marketing management. Upper Saddle River, NJ: PrenticeHall.
Kotler, P., Amstrong, G., Saunders, J., & Wong, V. (1997). Principles of marketing. London,
UK: The European Edition, Prentice Hall.
Kotler, P., & Amstrong, G. (2003). Những nguyên lý tiếp thị (tập 2). [Principles of marketing
(Vol. 2)]. Hanoi, Vietnam: NXB Thống kê.
Kotler, P., & Keller, K. L. (2006). Marketing management (14th ed.). New York, NY: Pearson
Prentice Hall.
Do T. T. Tram, Nguyen K. Duy. Journal of Science Ho Chi Minh City Open University, 9(1), 75-89 89
McDougall, G. H. G., & Levesque, T. (2000). Customer satisfaction with services: Putting
perceived value into the equation. Journal of Services Marketing, 14(5), 392-410.
doi:10.1108/08876040010340937
Nguyen, T. D. (2013). Phương pháp nghiên cứu khoa học trong kinh doanh. Tái bản lần 2.
[Scientific research method in business (2nd ed.)]. Hanoi, Vietnam: NXB Tài chính.
Oliver, R. L., & Bearden, W. O. (1985). Disconfirmation processes and consumer evaluations
in product usage. Journal of Business Research, 13(3), 235-246. doi:10.1016/01482963(85)90029-3
Parasuraman, A., Zeithaml, V. A., & Berry, L. L. (1985). A conceptual model of service
qualityand its implications for future research. Journal of Marketing, 49(4), 41-50.
Parasuraman, A., Zeithaml, V. A., & Berry, L. L. (1988). Servqual: A multipleitem scale for
measuring consumer perceptions of service quality. Journal of Retailing, 64(1), 12-40.
Parasuraman, A., Zeithaml, V. A., & Berry, L. L. (1998). Perceived service quality as a
customer‐based performance measure: An empirical examination of organizational
barriers using an extended service quality model. Human Resource Management 30(3),
335-364. doi:10.1002/hrm.3930300304
Phan, A. C. (2015). Chất lượng dịch vụ tại các doanh nghiệp Việt Nam. [Service quality at
businesses in Vietnam]. Hanoi, Vietnam: NXB Đại học Quốc Gia Hà Nội.
Turel, O., & Serenko, A. (2006). Satisfaction with mobile services in Canada: An empirical
investigation.
Elsevier
Telecommunications
Policy,
30(5),
314-331.
doi:10.1016/j.telpol.2005.10.003
Vu, D. T. (2002). Tiếp thị giữa các tổ chức. [Marketing Organization]. Ho Chi Minh City,
Vietnam: NXB Đại học Quốc Gia TP. HCM.
Wang, Y., Lo, H. P., & Yang, Y. (2004). An integrated framework for service quality, customer
value, satisfaction: Evidence from China's telecommunication industry. Information
Systems Frontiers, 6(4), 325-340. doi:10.1023/B:ISFI.0000046375.72726.67
Woo, K.-S., & Fock, H. K. Y. (1999). Customer satisfaction in the Hong Kong mobile phone
industry.
The
Service
Industry
Journal,
19(3),
162-174.
doi:10.1080/02642069900000035
Woodruff, R. B. (1997). Customer value: The next source for competitive advantage. Journal
of the Academy of Marketing Science, 25(2), 139-153. doi:10.1007/BF02894350.
Zeithaml, V. A. (1988). Consumer perceptions of price, quality, and value: A means-end model
and
synthesis
of
evidence.
Journal
of
Marketing,
52(3),
2-22.
doi:10.1177/002224298805200302
Zeithaml, V., Berry, L., & Parasuraman, A. (1996). The behavioral consequences of service.
Journal of Marketing, 60(2), 31-46. doi:10.2307/1251929
Zeithaml, V. A., & Bitner, M. J. (2000). Services marketing: Integrating customer focus across
the firm. Boston, MA: Irwin McGraw- Hill.